Opportunity sizing
This example estimates a possible lift in the movie watch rate from a growth hypothesis and compares it to the impact from a subsequent experiment.
Video
SOL query
// Filter to events before the subsequent experiment
match EndEvent()
if (EndEvent.ts <'2024-05-01') and (SUFFIX[0].ts >='2024-05-01')
replace SEQ with PREFIX >> MATCHED

// Sessionize the data
match split Session()+
if duration(Session[-1], SUFFIX[0]) > 1h

// Tag the final page a user sees before watch_start as LastTouch
match split LastTouch(home_page | search_page | favorites_page | top_movies_page) >> (^home_page, search_page, favorites_page, top_movies_page)* >> watch_start?

// Pull our key outcome onto the sequence
set watched = length(watch_start)
Key steps
- Limit ourselves to events before a certain date.
match EndEvent()
if (EndEvent.ts <'2024-05-01') and (SUFFIX[0].ts >='2024-05-01')
replace SEQ with PREFIX >> MATCHED
- Sessionize sequences with a 1 hour gap.
match split Session()+
if duration(Session[-1], SUFFIX[0]) > 1h
- Break sequences into every attributable "last-touch" and include watch_start, if it exists.
match split LastTouch(home_page | search_page | favorites_page | top_movies_page) >> (^home_page, search_page, favorites_page, top_movies_page)* >> watch_start?
- Store the key outcome on the sequence as a binary number.
set watched = length(watch_start)
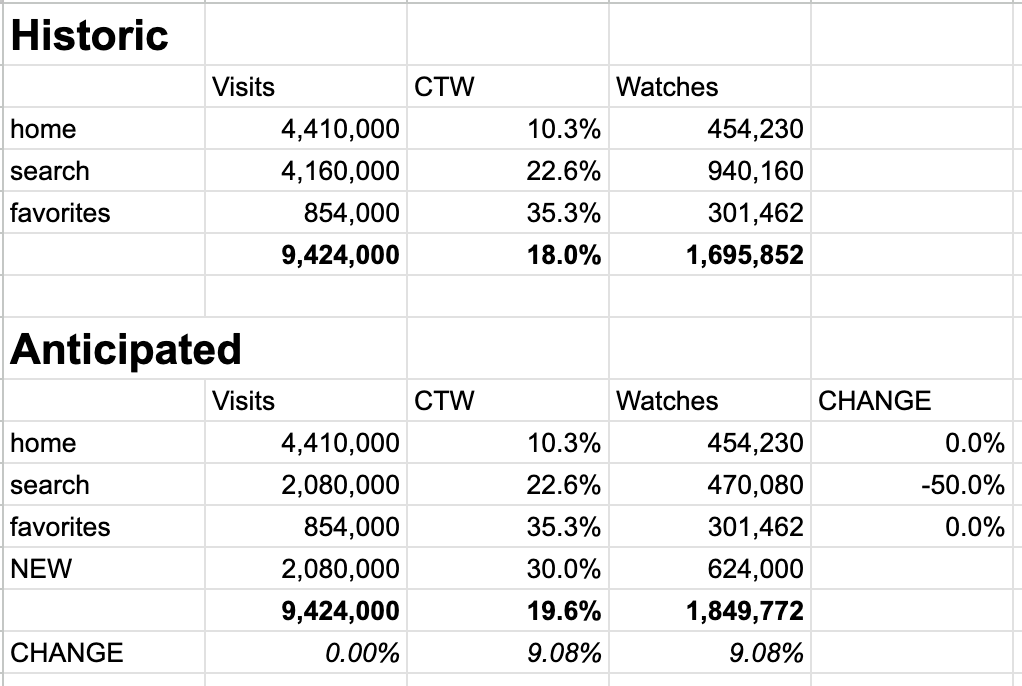
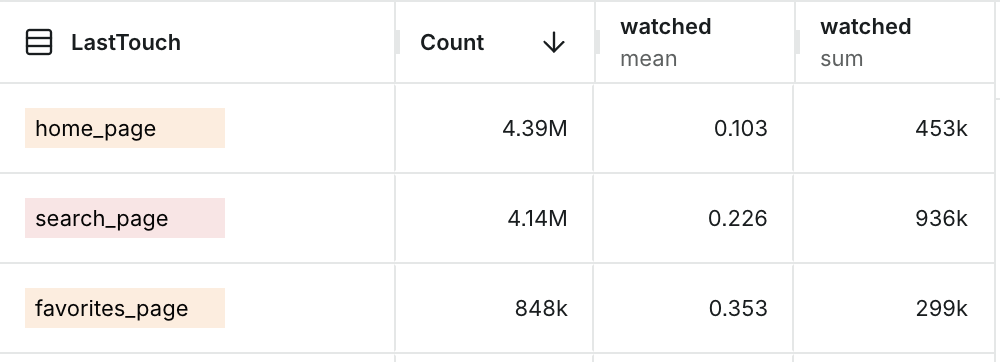
- In the table, calculate the funnel from last-touch, through each page's conversion rate into the number of
watch_startevents it yielded.
- In a spreadsheet, develop a realistic scenario for improving yield. In this case we estimated a 50% decline in search and a 9% increase in yield.