Causal factors
This page explains how to generate a Causal Factors report on your data. For details on the methodology, please refer to the blog posts on causal discovery for product analytics and foundation models of event sequences.
Process
-
Provide your data: In order to generate a Causal Factors report, we will train our transformer model directly on your events data. You can send us your data in any secure manner that is most convenient for you (such as parquet files or s3 bucket). The expected format is a dataset of 1M-50M rows with three required columns (
actor/user ID,timestamp, andevent name/type). Please see the documentation on data format for more details. -
Define outcomes: Choose outcomes in your product that matter to you, whether its a goal or an event you'r trying to avoid.
- Outcomes: Provide the outcomes in your product that matter most to you. These could be conversion events such as purchases or sign-ups, or negative events such as cancellations.
- Dimensions: Any additional important columns in your dataset.
We are happy to meet with you to discuss this information in more detail and answer any questions you may have.
-
Run the model: Motif's causal discovery engine generates and ranks thousands of hypotheses for cause effect relationships. In most cases we'll be able to provide your report within 48 hours.
-
Explore your report: Once report generation is complete, you will be able to view a sample of the report in the Motif UI. At this time we will be available to go over the report results with you and collect payment for access to the full report.
Understanding the report
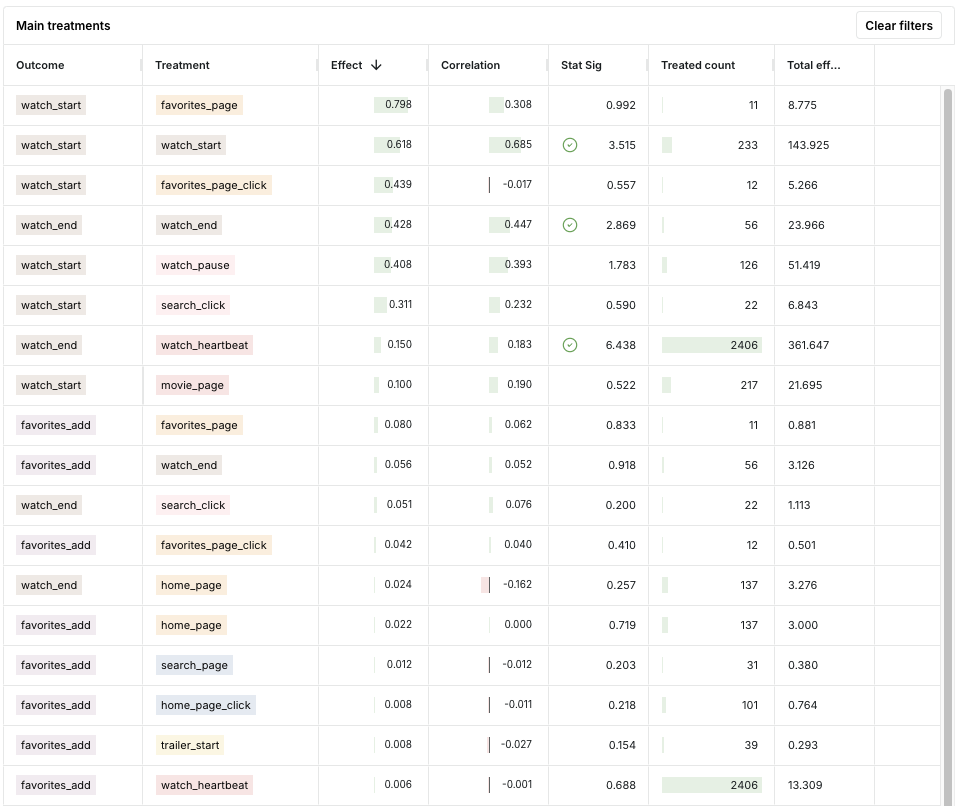
Main effects
The report consists of an interactive table of results with the following columns:
- Outcome: The target event(s) (the dependent variable)
- Treatment: The treatment event(s). The treatment must always occur before the outcome in any sequence.
- Effect: The adjusted, modeled treatment effect. For binary outcomes, the effect can be interpreted as a difference in probability of the outcome occurring in the presence vs absence of the treatment.
- Correlation: The unadjusted, correlational effect.
- Stat Sig: This column contains a checkmark if the hypothesis is statistically significant at the 95% level, and the number indicates the corresponding t-statistic. The column can be toggled to show only statistically significant effects.
- Treated count: The prevalence of the treatment in the dataset (i.e. the number of sequences in which the treatment occurs)
- Total effect: Equal to the Effect multiplied by the Treated count. The Total effect is an estimate of the opportunity size associated with a particular (outcome, treatment) pair.
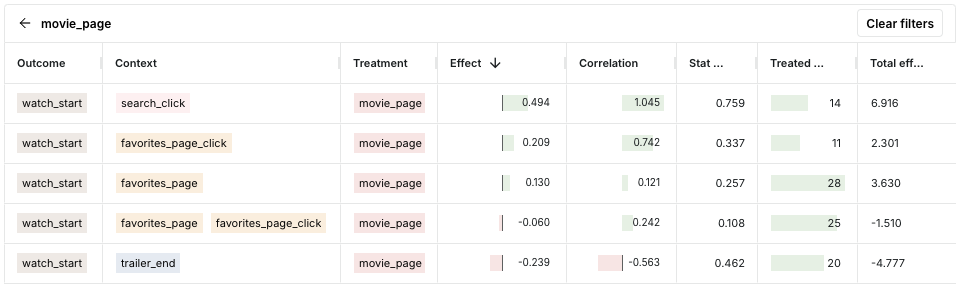
Contextual effects
Clicking on any row in the Main effects table allows you to drill down into a single treatment in more detail. This table is identical to the Main effects table except for an additional column containing the Context.
- Context: Variable along which to define the heterogeneous effect. These can be individual events or more complicated contexts such as sequences of events, repeated occurrences of events, or temporal variables. The context must always occur before the treatment in any sequence.