Root cause analysis
info
View this example in Motif here.
This is an investigation into a change in the volume of watch_start events
that occurred on June 24.
Video
SOL query
// remove events before June 1
match StartEvent()
if StartEvent.ts >= '2024-06-01'
replace SEQ with MATCHED >> SUFFIX

// for each event, if it occurred after June 24 add a flag that's true, otherwise false
match split Event()
set Event.in_problem_area = Event.ts >= '2024-06-24'
combine

// sessionize
match split Session()+
if duration(Session[-1], SUFFIX[0]) > 1h

// align sequences on home_page eventually followed optionally by watch_start
match home_page >> * >> watch_start?

//match split favorites_page >> Destination()
Key steps
- First we looked at the drop in `watch_start events over time, but sessionizing and doing a simple match.
match split Session()+
if duration(Session[-1], SUFFIX[0]) > 1h

match home_page >> * >> watch_start?
- Then we removed all events before June 1, so we had a window just before and after the drop.
match StartEvent()
if StartEvent.ts >= '2024-06-01'
replace SEQ with MATCHED >> SUFFIX
- Then we added a flag to every event that denoted whether or not it occurred inside the problem area.
match split Event()
set Event.in_problem_area = Event.ts >= '2024-06-24'
combine
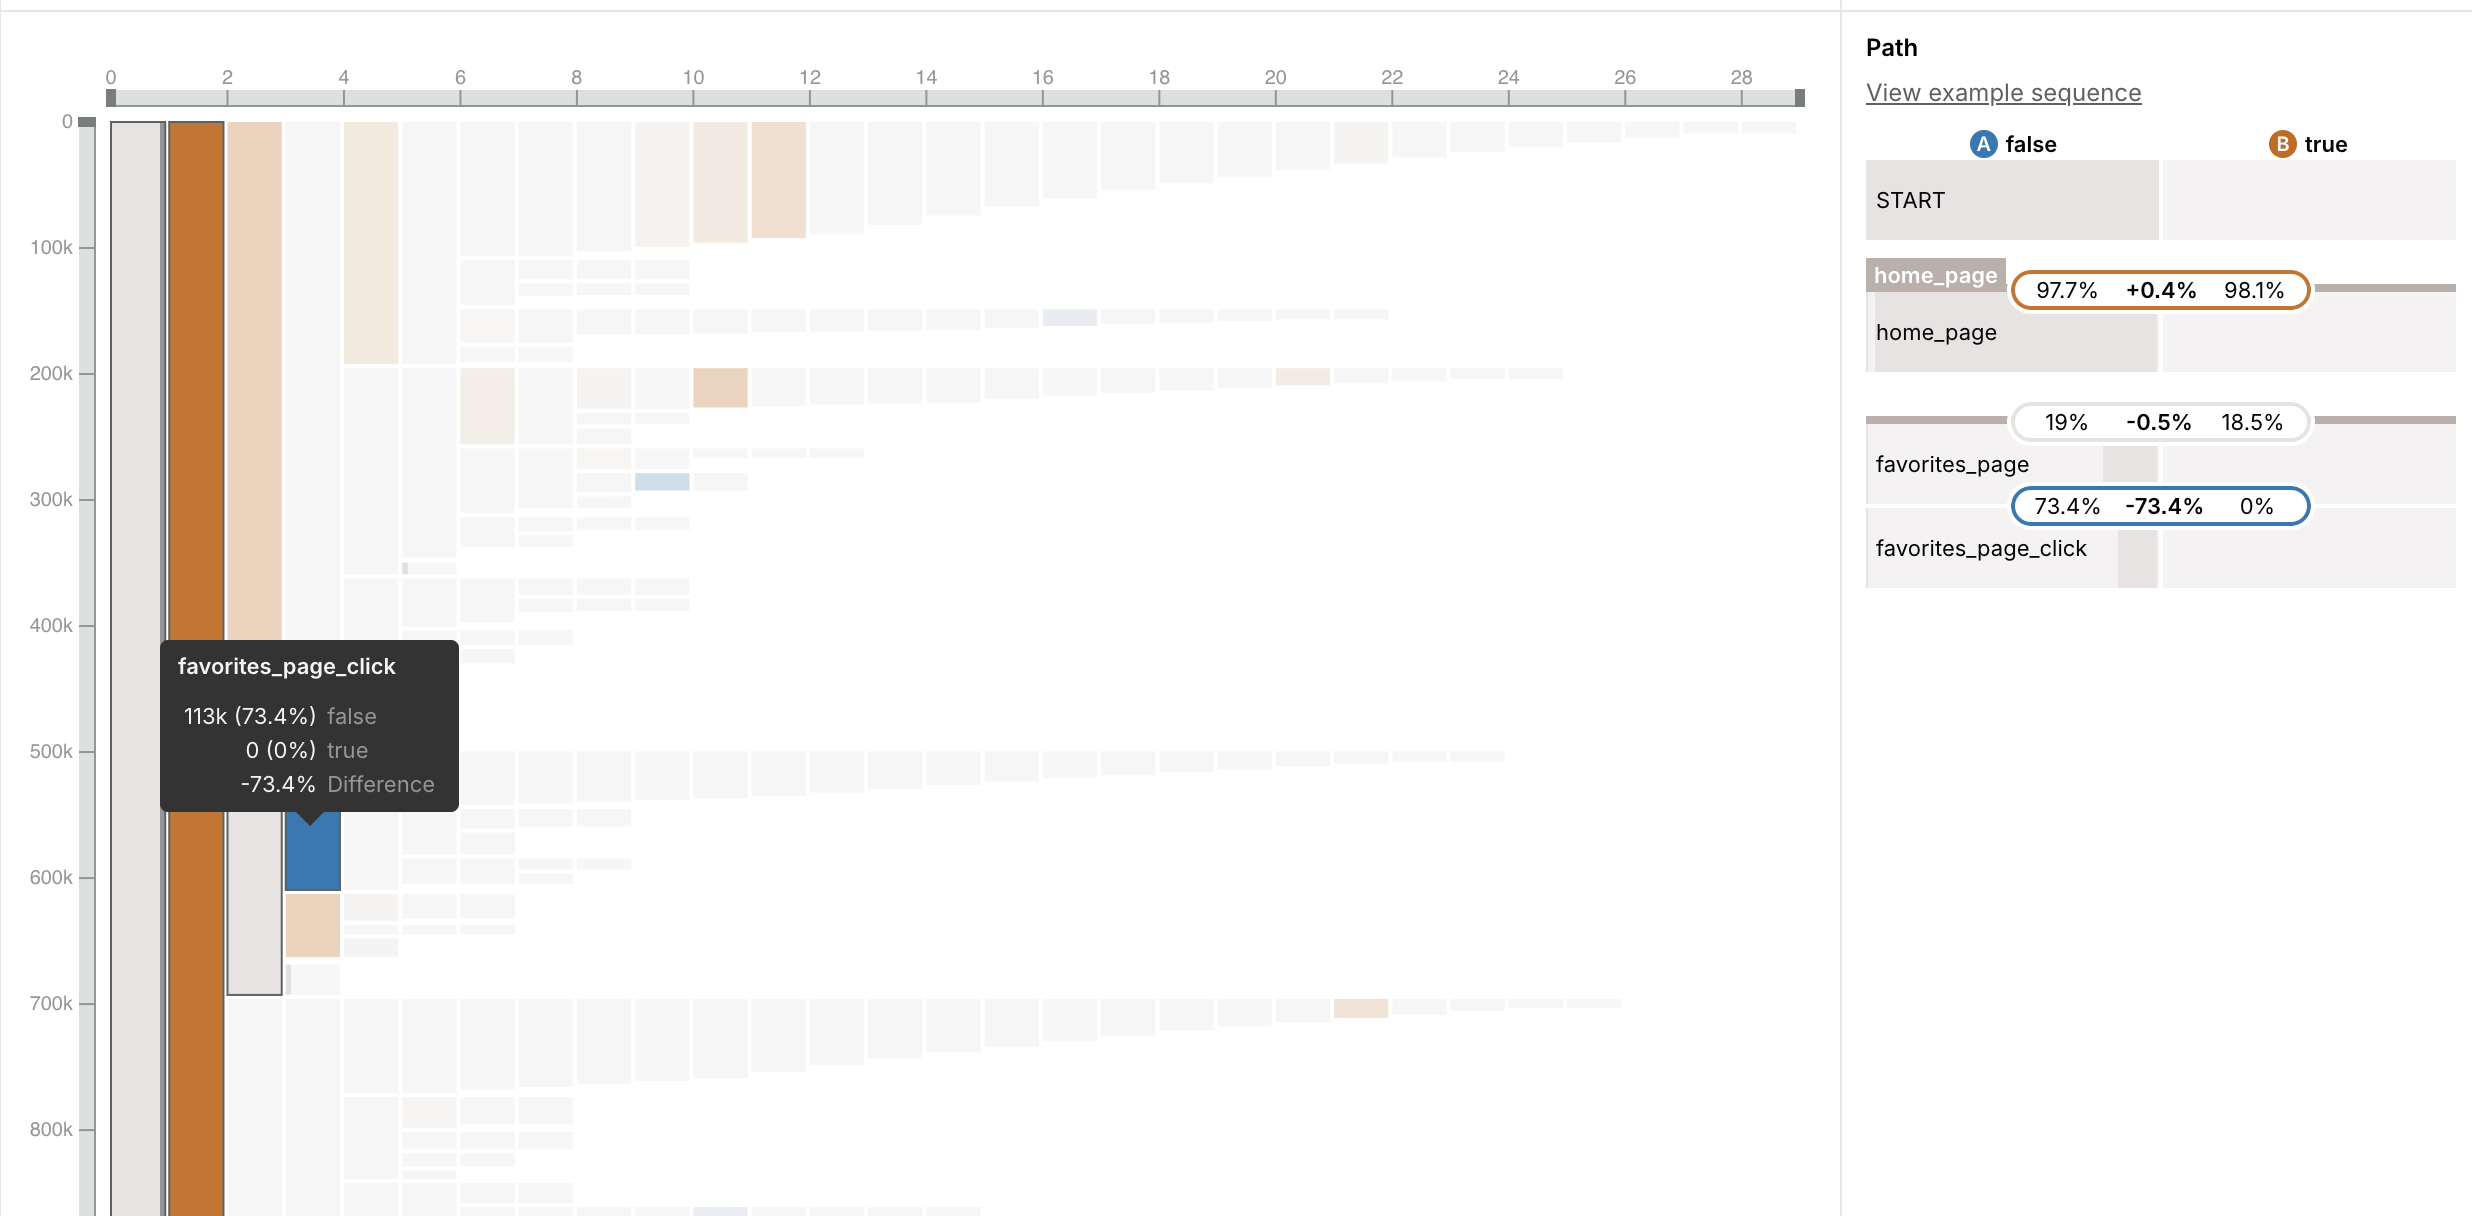
- That allowed us to use the Compare feature of the barcode to see a big drop in favorites_page_click events.
- We switched our analysis to be on
favorites_pageand the event immediately following it.
//match home_page >> * >> watch_start?

match split favorites_page >> Destination()
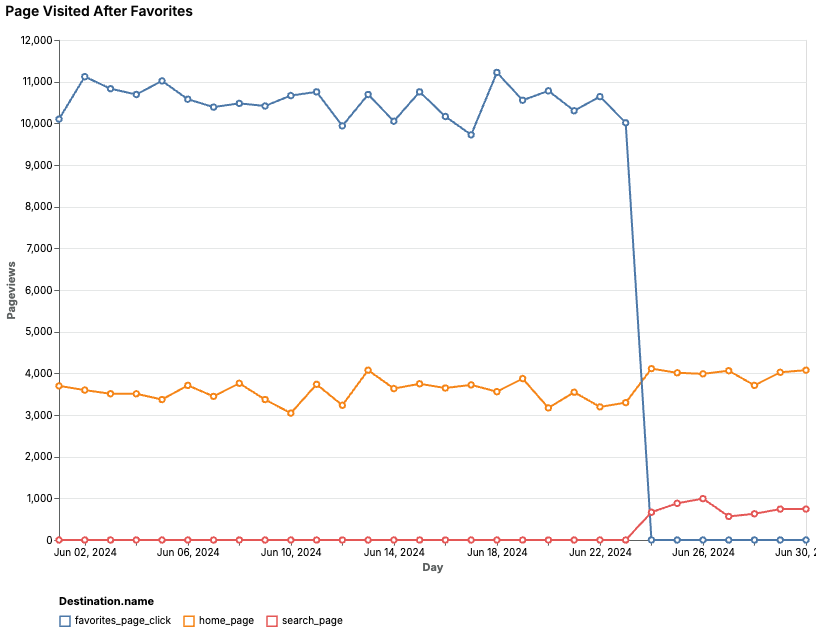
- We then plotted the number of
favorites_pagevisits grouped by the name of the Destination page.
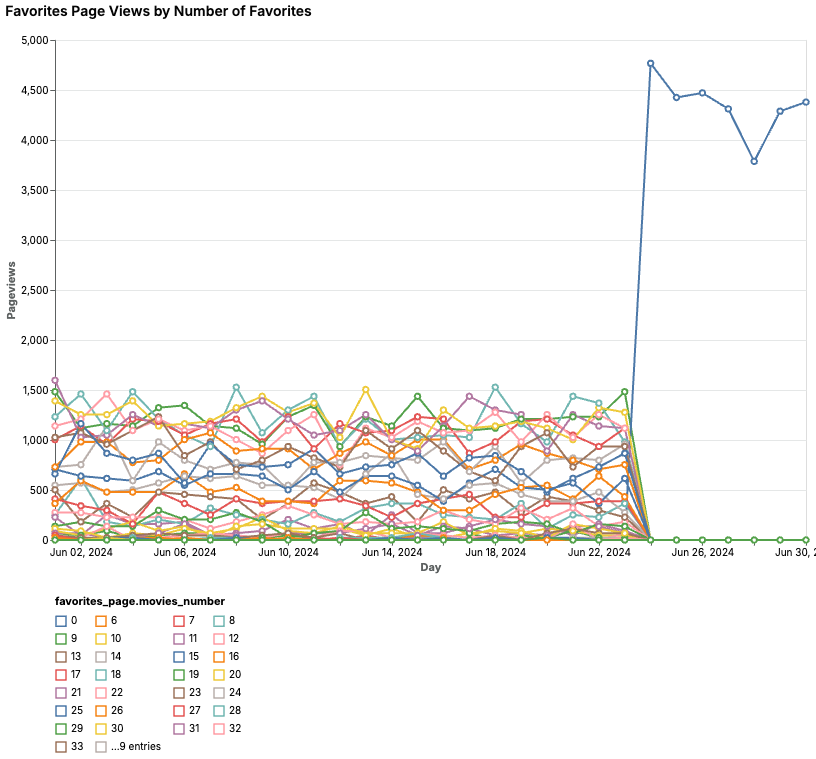
- Finally, we looked at the number of favorites displayed on the favorites page and see that for all users it dropped to zero.