Experiment analysis
This multi-part example isolates users and activity impacted by an experiment, creates a segment based on the experiment variant and then analyzes the impact of the experiment multiple ways.
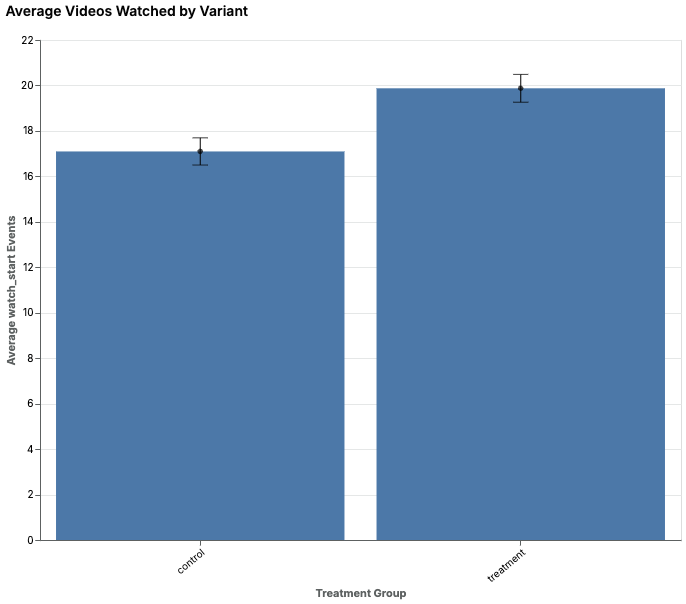
Analysis 1: Analyzing impact on watch volume
info
View this example in Motif here.
Video
SOL query for Analysis 1
// Match our experiment signifier
match experiment_exposure
if experiment_exposure.experiment = "top_movies_xp"
// Take the user's variant and add it to the sequence
set variant = experiment_exposure.variant
// Limit our analysis to users in the experiment
filter MATCHED
// Remove events from before our experiment started
replace PREFIX with null

// Analysis 1: Volume of Watch Starts
// Remove all non-watch_start events
match split A(^watch_start)*
replace A with null
combine
// Use the sequence length to add up the number of watch_start events
set num_watches = length(SEQ)
Key steps
- We match on the event the denotes the start of the experiment, then grab the variant from the event and assign it to the user’s sequence.
match experiment_exposure
set variant = experiment_exposure.variant
- We limit our analysis to users in the experiment, and remove all events before the event denoting the experiment start
filter MATCHED
replace PREFIX with null
- We match sequences of any length that don’t include
watch_startand give them the tag A. This is a match split, so we divide the sequence based on the matches we find, then we replace matches with null and recombine. This effectively removes all non-watch_startevents.
match split A(^watch_start)*
replace A with null
combine
- Now that sequences contain only
watch_startevents, we can calculate the number based by using the length of the sequence
set num_watches = length(SEQ)
- We plot the average number of watches within each variant of the experiment.
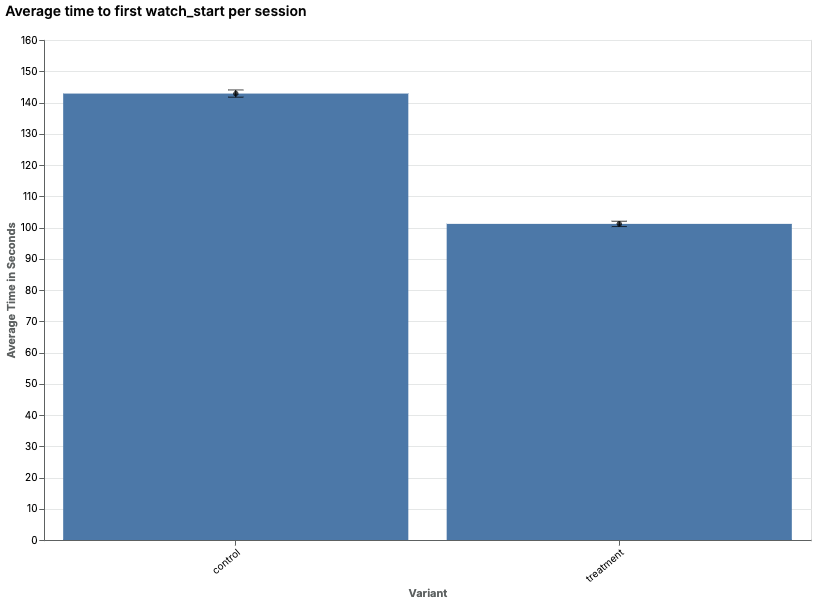
Analysis 2: Analyzing change in time to first watch
info
View this example in Motif here.
Video
SOL query for Analysis 2
// Match our experiment signifier
match experiment_exposure
if experiment_exposure.experiment = "top_movies_xp"
// Take the user's variant and add it to the sequence
set variant = experiment_exposure.variant
// Limit our analysis to users in the experiment
filter MATCHED
// Remove events from before our experiment started
replace PREFIX with null

// Analysis 2: Time to First Watch Per Session
// Sessionize
match split Session()+
if duration(Session[-1], SUFFIX[0]) > 1h
// Match the first watch_start in the session
match watch_start
// Calculate the time between session start and the first watch_start, setting null values to 5 minutes
set dur = coalesce(duration(SEQ[0], watch_start),5m)
// Recombine sessions into a single user sequence, averaging the time to watch_start for each session
combine avgdur= avg(dur)
Key steps
- We use our standard sessionization query to divide user sequences into sessions.
match split Session()+
if duration(Session[-1], SUFFIX[0]) > 1h
- Then we match the first
watch_startin each session, and calculate the time between the start of the session and thatwatch_start. Null values are replaced with 5 minutes.
match watch_start
set dur = coalesce(duration(SEQ[0], watch_start),5m)
- Finally, we recombine sessions into user sequences and average the time it
took to get to the first
watch_startin each of the user’s sessions.
combine avgdur = avg(dur)
- We plot the average time-to-first-watch within each variant of the experiment.
Analysis 3: Checking impact on cannibalization
info
View this example in Motif here.
Video
SOL query for Analysis 3
// Match our experiment signifier
match experiment_exposure
if experiment_exposure.experiment = "top_movies_xp"
// Take the user's variant and add it to the sequence
set variant = experiment_exposure.variant
// Limit our analysis to users in the experiment
filter MATCHED
// Remove events from before our experiment started
replace PREFIX with null

// Analysis 3: Discovery Source
// Perform a last-touch attribution for every watch_start event
match split LastTouch(home_page | search_page | favorites_page | continue_watching | top_movies_page) >> (^home_page, search_page, favorites_page, continue_watching, top_movies_page)* >> watch_start
Key steps
- Nearly identical to our attribution query, we look at how the experiment
changed the last touch before
watch_start.
match split LastTouch(home_page | search_page | favorites_page | continue_watching | top_movies_page) >> (^home_page, search_page, favorites_page, continue_watching, top_movies_page)* >> watch_start
- We see that the new top_movies_page is incredibly successful at driving
watch_startevents and cannibalizes mostly from search_page.
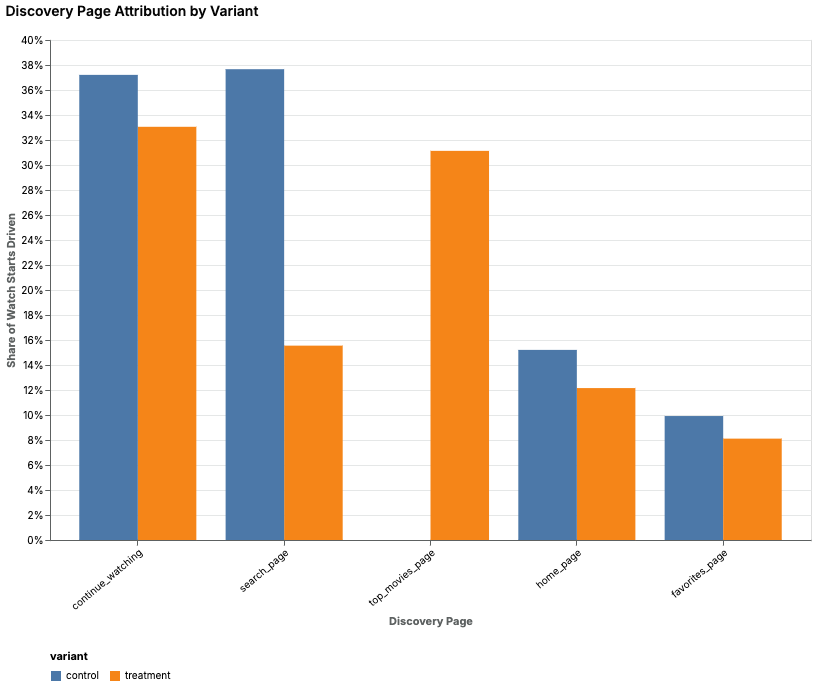
- Using the barcode we can see some second-order effects, like an increase in favorites_page activity.
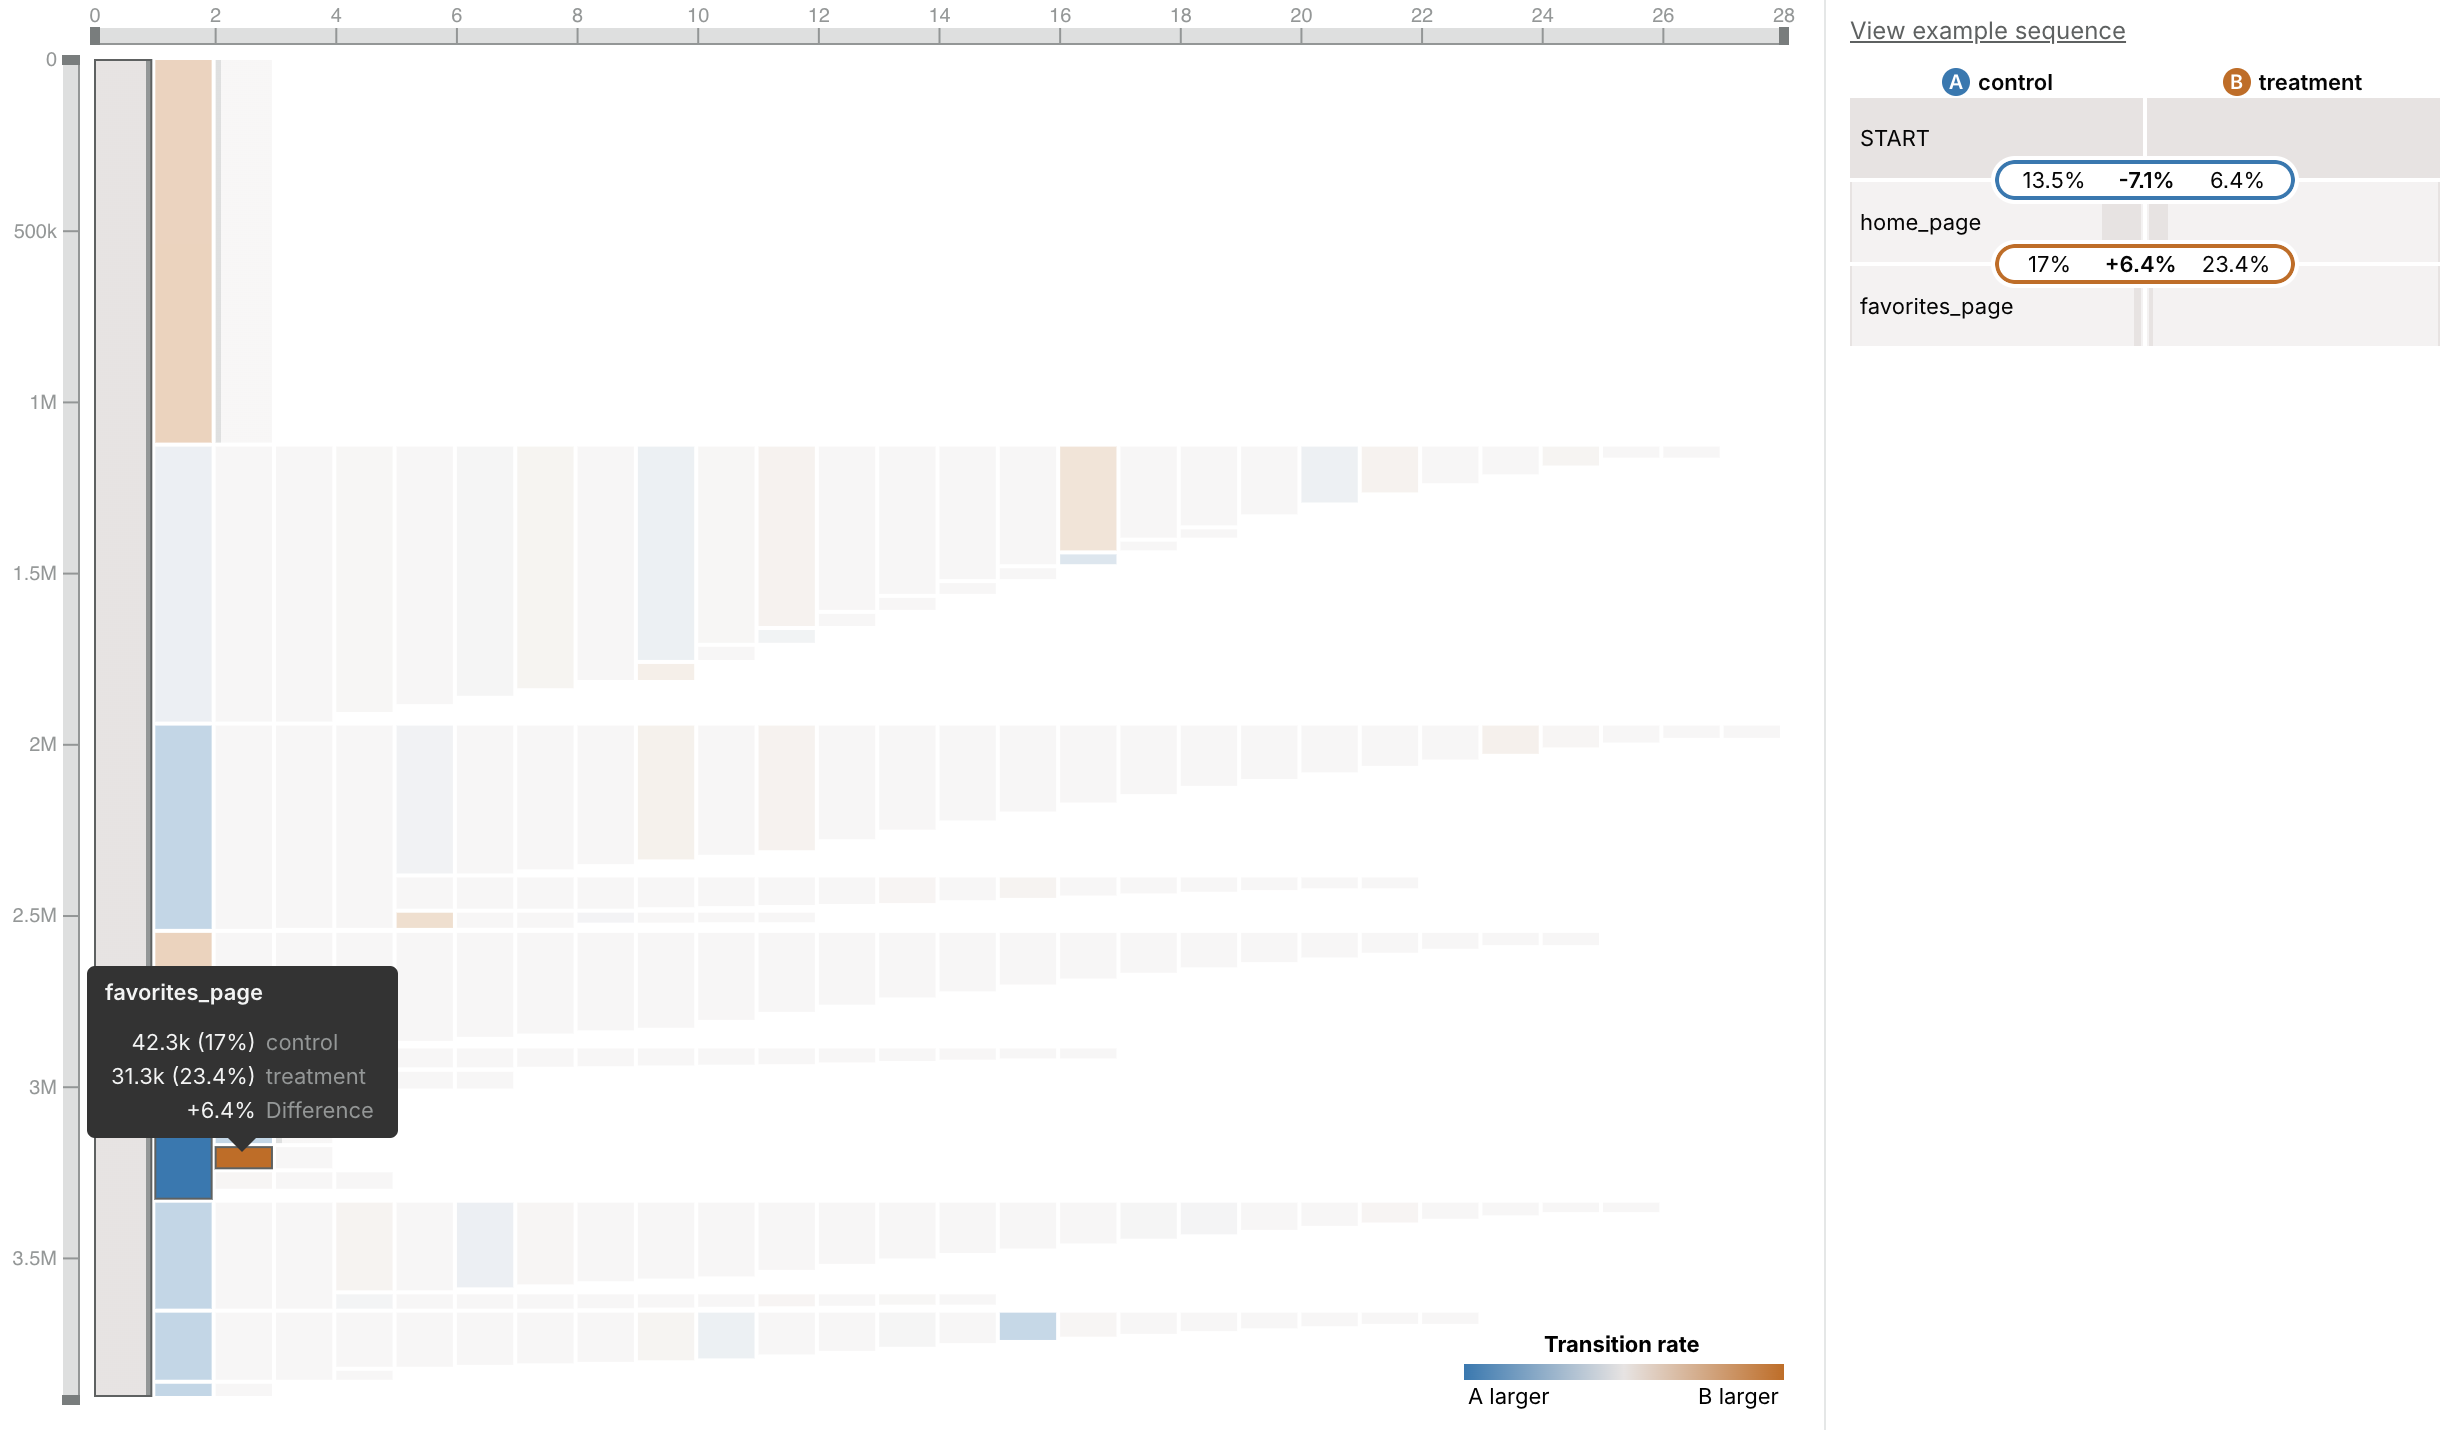
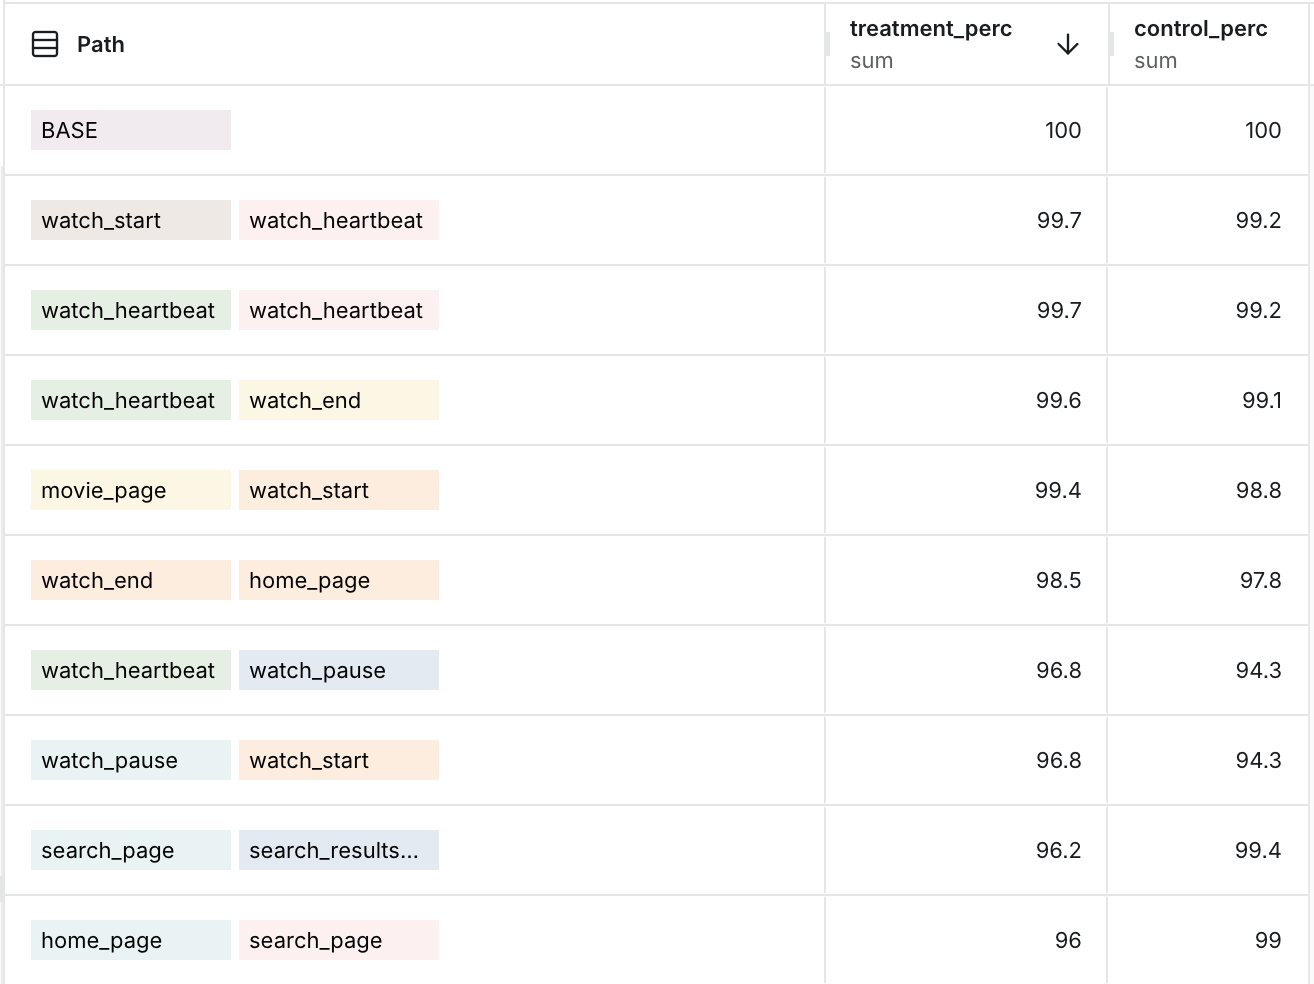
Analysis 4: Effect on Event Transition Probabilities
info
View this example in Motif here.
Video
SOL query for Analysis 4
// Match our experiment signifier
match experiment_exposure
if experiment_exposure.experiment = "top_movies_xp"
// Take the user's variant and add it to the sequence
set variant = experiment_exposure.variant
// Limit our analysis to users in the experiment
filter MATCHED
// Remove events from before our experiment started
replace PREFIX with null
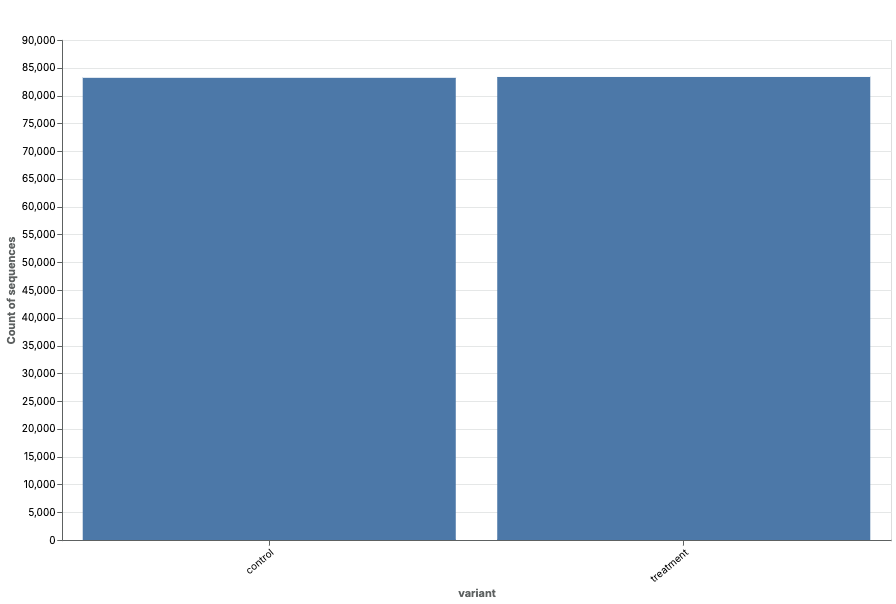
// Store treatment & control group sizes
set treatment_size = 83351
set control_size = 83212
// Calculate marginal effect for each user
set treatment_perc = if(variant = 'treatment',1,0) / treatment_size * 100
set control_perc = if(variant = 'control',1,0) / control_size * 100
// Limit to events in the first day following the experiment
match Events()+
if duration(Events[0], SUFFIX[0]) > 1d
// On each event, store a string called "pair" with the previous event and current event
set SEQ[1:].pair = concat(SEQ[:-1].name, " >> ", SEQ[1:].name)
set SEQ[0].pair = 'BASE'
// Split each event into a new sequence if it's "pair" value is unique
match split A()
if A.pair not in PREFIX.pair
// Store the value of "pair" on the sequence
set __PATH = A.pair
Key steps
- Calculate the size of treatment and control by plotting.
- For each user, calculate their marginal contribution.
set treatment_size = 83351
set control_size = 83212
set treatment_perc = if(variant = 'treatment',1,0) / treatment_size * 100
set control_perc = if(variant = 'control',1,0) / control_size * 100
- Limit our analysis to events in the first day following the experiment
match Events()+
if duration(Events[0], SUFFIX[0]) > 1d
- Create a new dimension on each event called "pair", which is the combination of the previous event name and the current event name. For the first event, set it to the value "BASE"
set SEQ[1:].pair = concat(SEQ[:-1].name, " >> ", SEQ[1:].name)
set SEQ[0].pair = 'BASE'
- Split each sequence into single events, only if the "pair" value is new for that sequence. Finally, copy the value of pair from the event to the sequence.
match split A()
if A.pair not in PREFIX.pair

set __PATH = A.pair
- Use the table view to group-by the
__PATH, and calculate the sum of the marginal contributions:treatment_percandcontrol_perc. From here you can compare the impact on every event transition.