Quickstart
In 15 minutes, this tutorial will teach you how to run a basic analysis in Motif.
We'll be using the “Motiflix” dataset, which is simulated based on common user sessions in a movie streaming service like Netflix. Let's imagine that we are analysts on the Motiflix growth team and are exploring ways to improve search experience to increase movie watches.
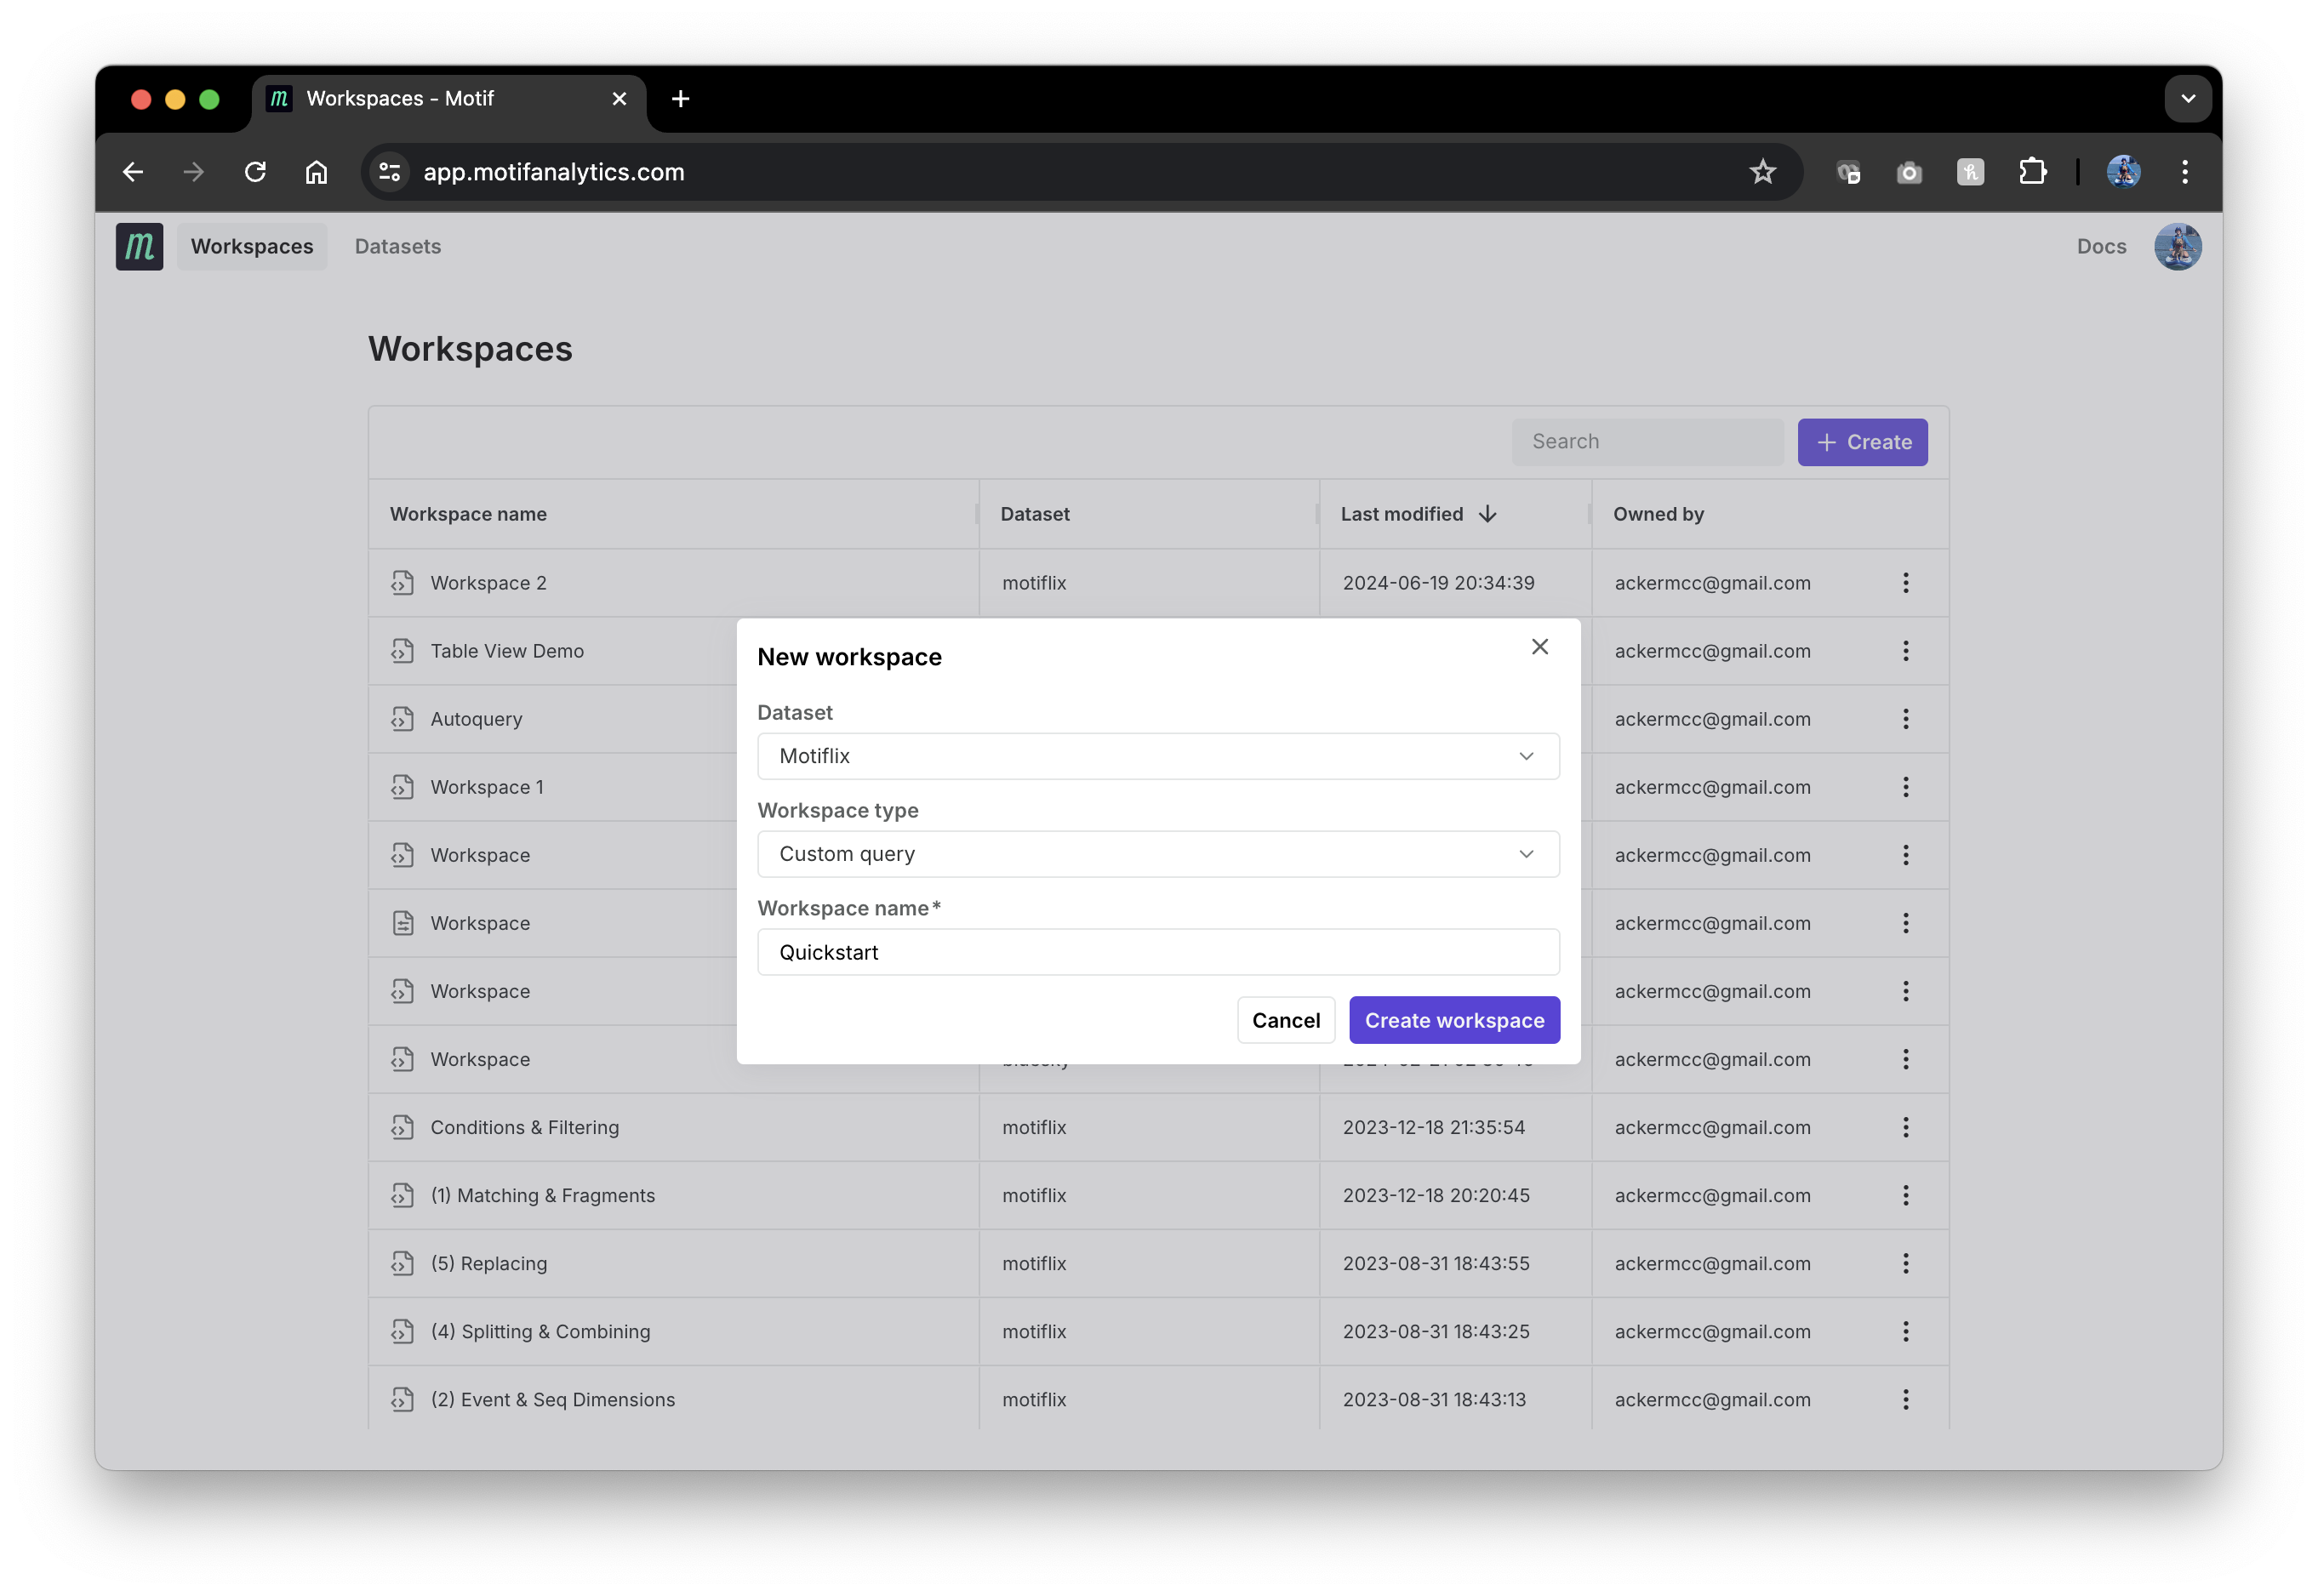
Select + Create from the Workspaces tab to create a workspace. Choose the
Motiflix dataset, Custom query workspace type, and name it "Quickstart" (or
whatever you'd like).
Matching event patterns with SOL
Motif uses a small but powerful Sequence Operations Language (SOL) to query sequences. The most basic SOL query is finding sequences with a specific event, for example, finding when Motiflix users performed a search (viewed search results page):
match search_results_page
This query finds the first event called search_results_page in each
sequence and tags it, so it can be highlighted in visualizations and used in
subsequent SOL operations. The best way to understand how SOL queries work is by
viewing their results in the “Examples” view:
You can interactively explore the examples in this guide by clicking "Open in App" in the screenshots, which will take you directly to the app.
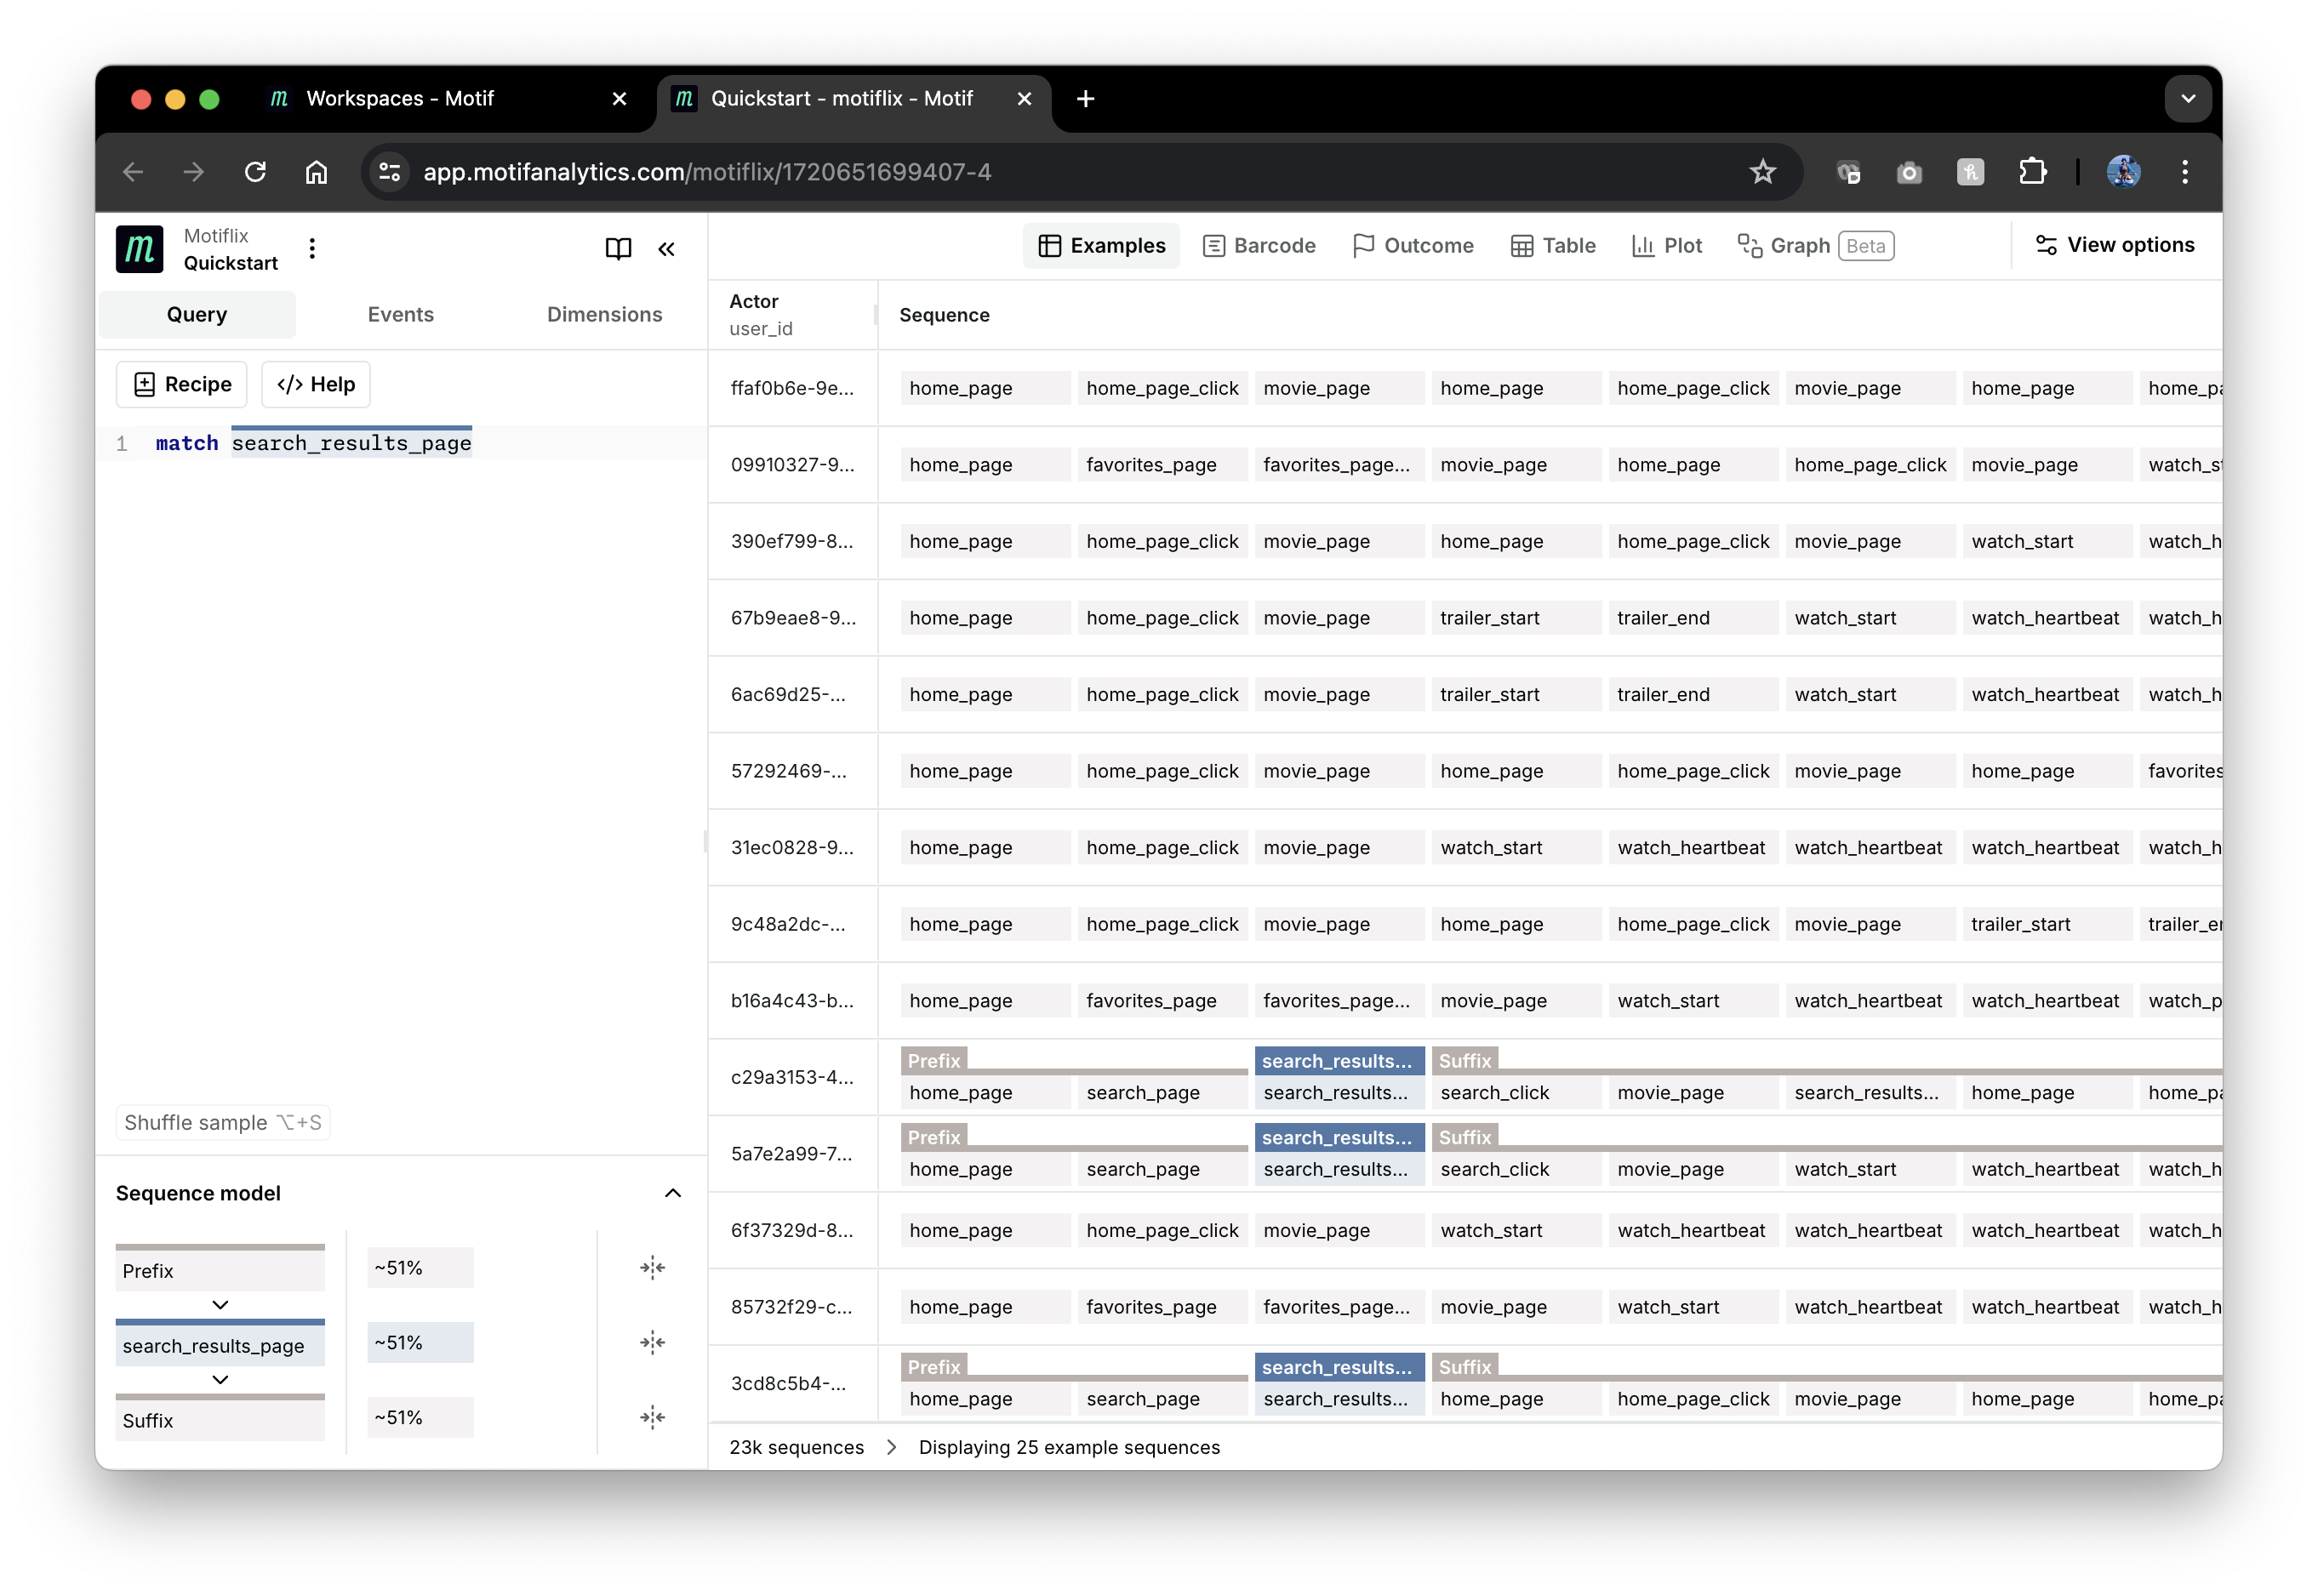
The match operation tags matched events but does not remove sequences without
matches. Notice that matches to search_results_page events have blue tags
above them. Sequences without matches don't have tags. Matched events are
preceded with a Prefix tag, which is automatically added and contains all
events before the match. You can expand Prefix to see its events by hovering
over its pill in the "Tag map" above the visualization.
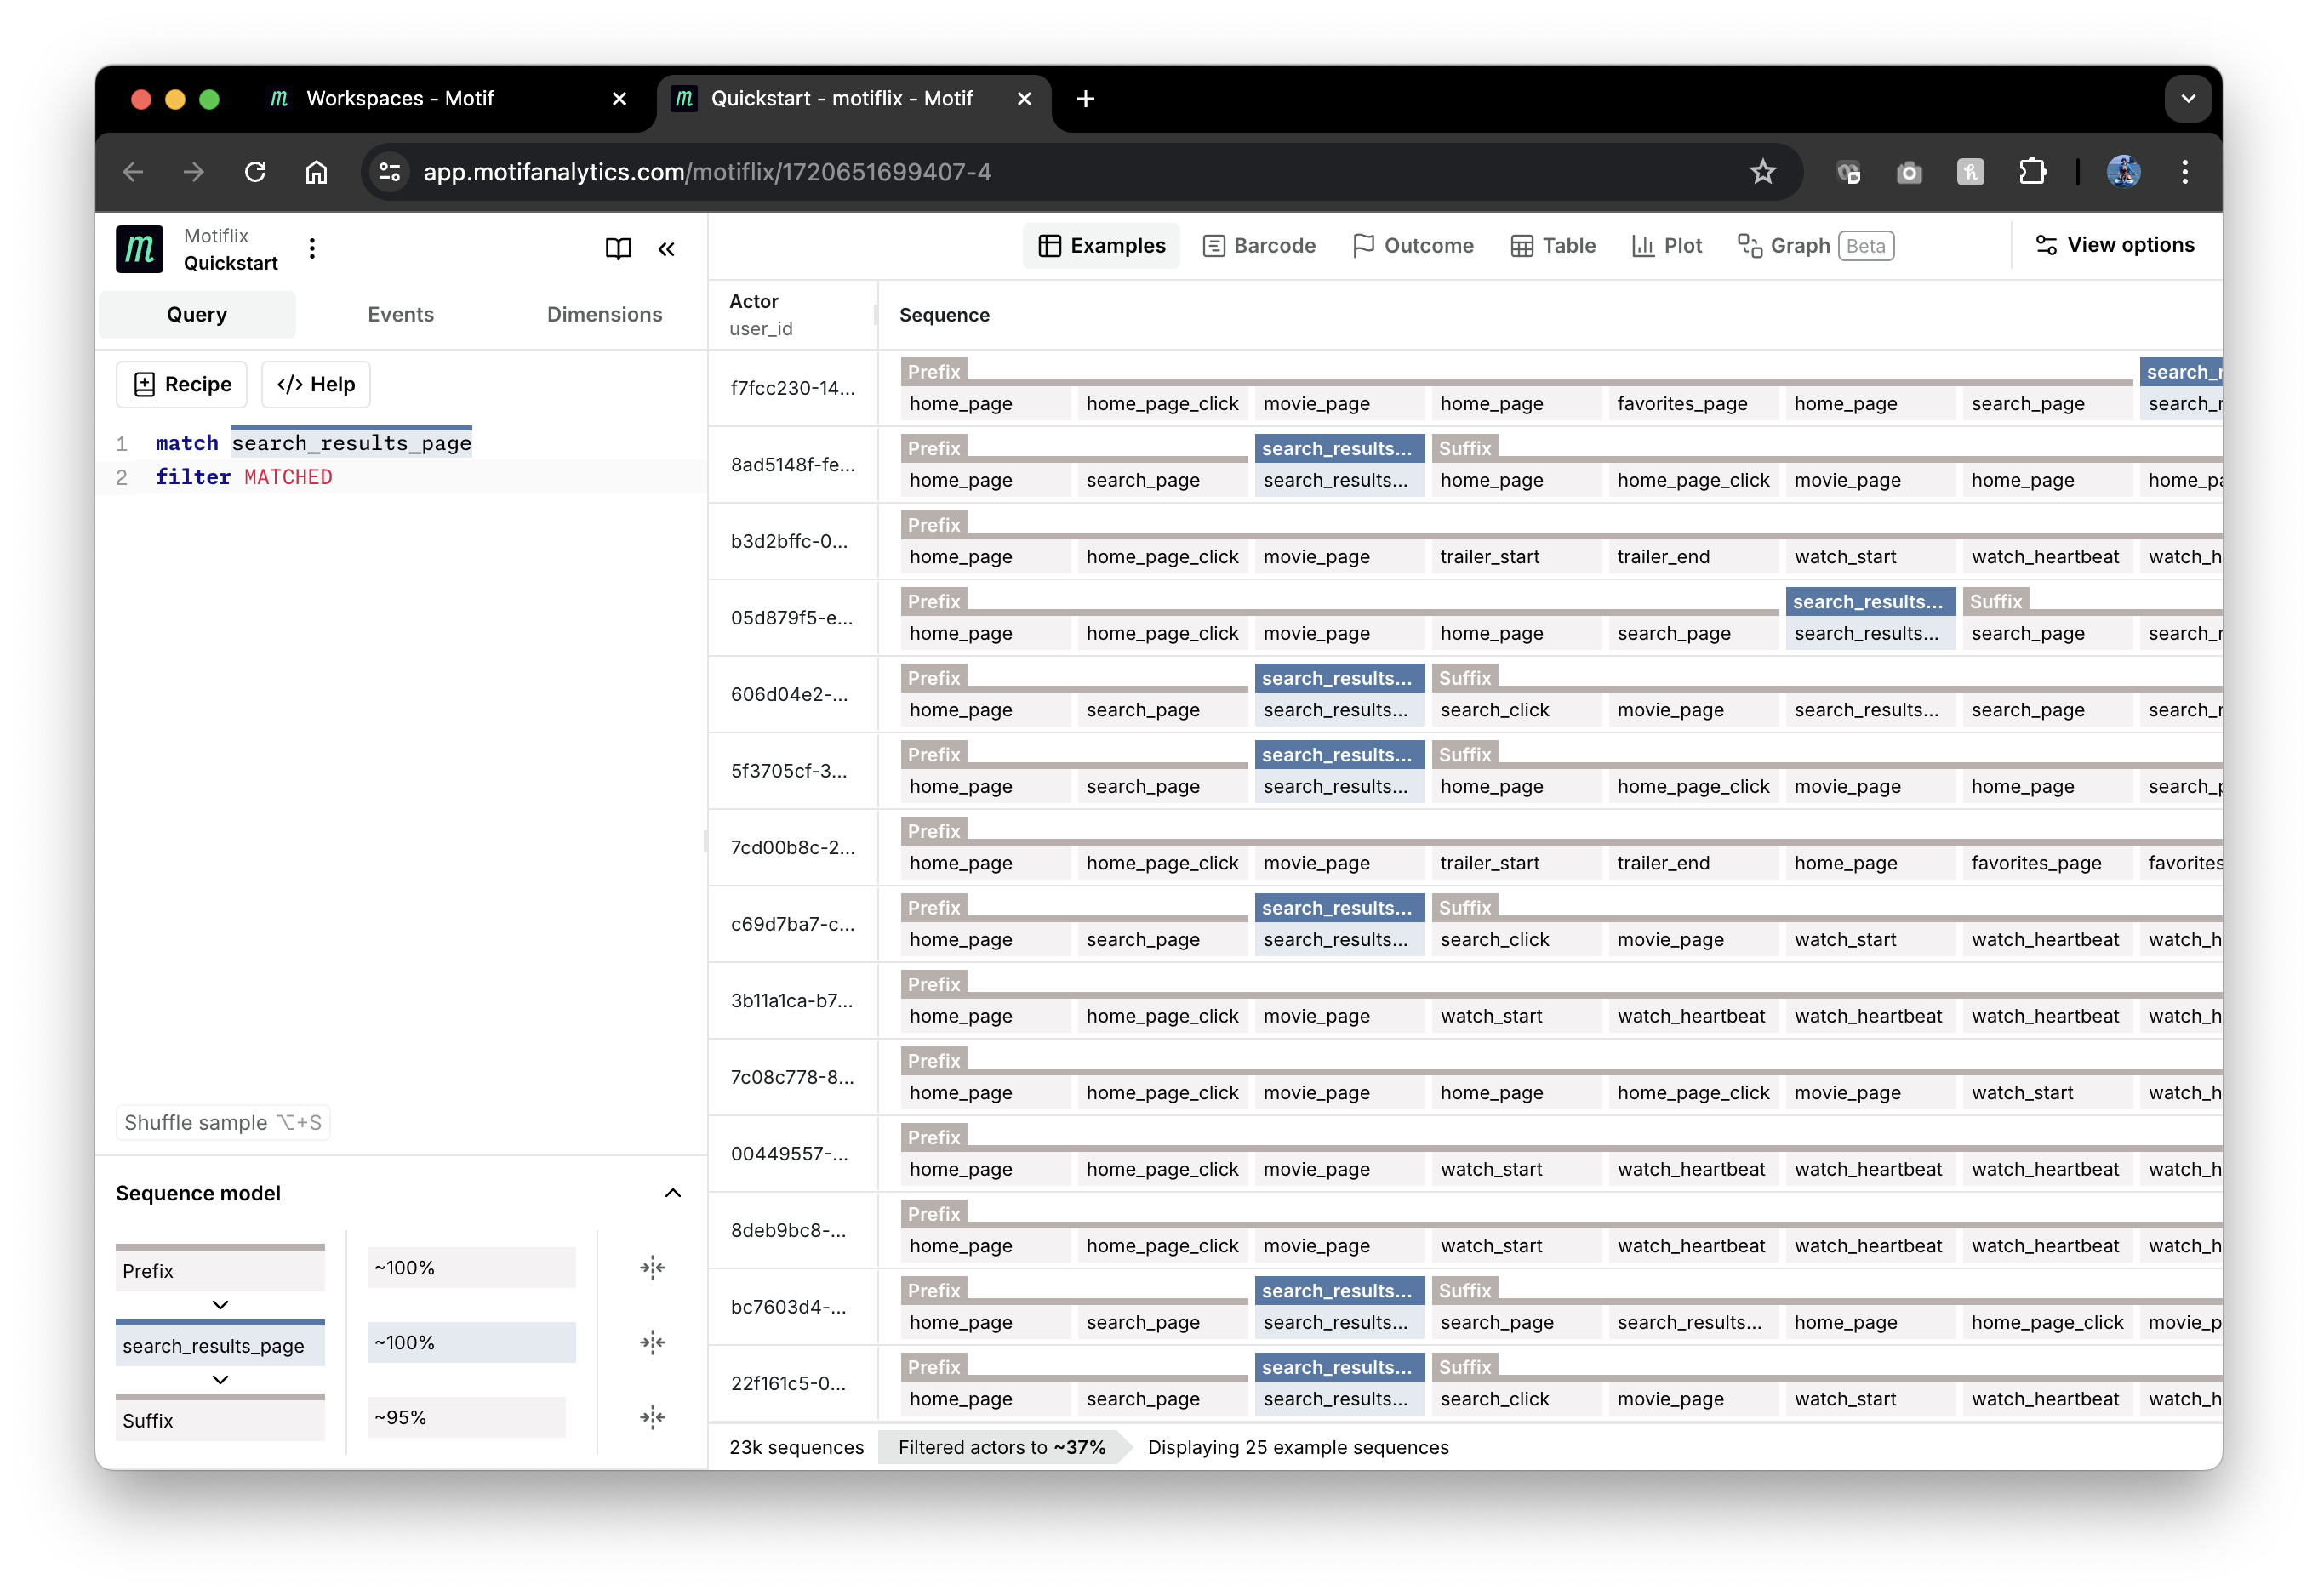
To filter out sequences without matches, we can add the filter operation:
match search_results_page
filter MATCHED
Here MATCHED is another automatically added tag, consisting of all matched
events. Filtering removes sequences without it.
To narrow down to situations where searching was followed later by starting to watch a movie, we can use the following query:
match search_results_page >> * >> watch_start
filter MATCHED
Here we define a match pattern consisting of 3 consecutive states. *
in the 2nd state matches any event any number of times - similar to
quantifiers in regular expressions. Here is a screenshot of the result:
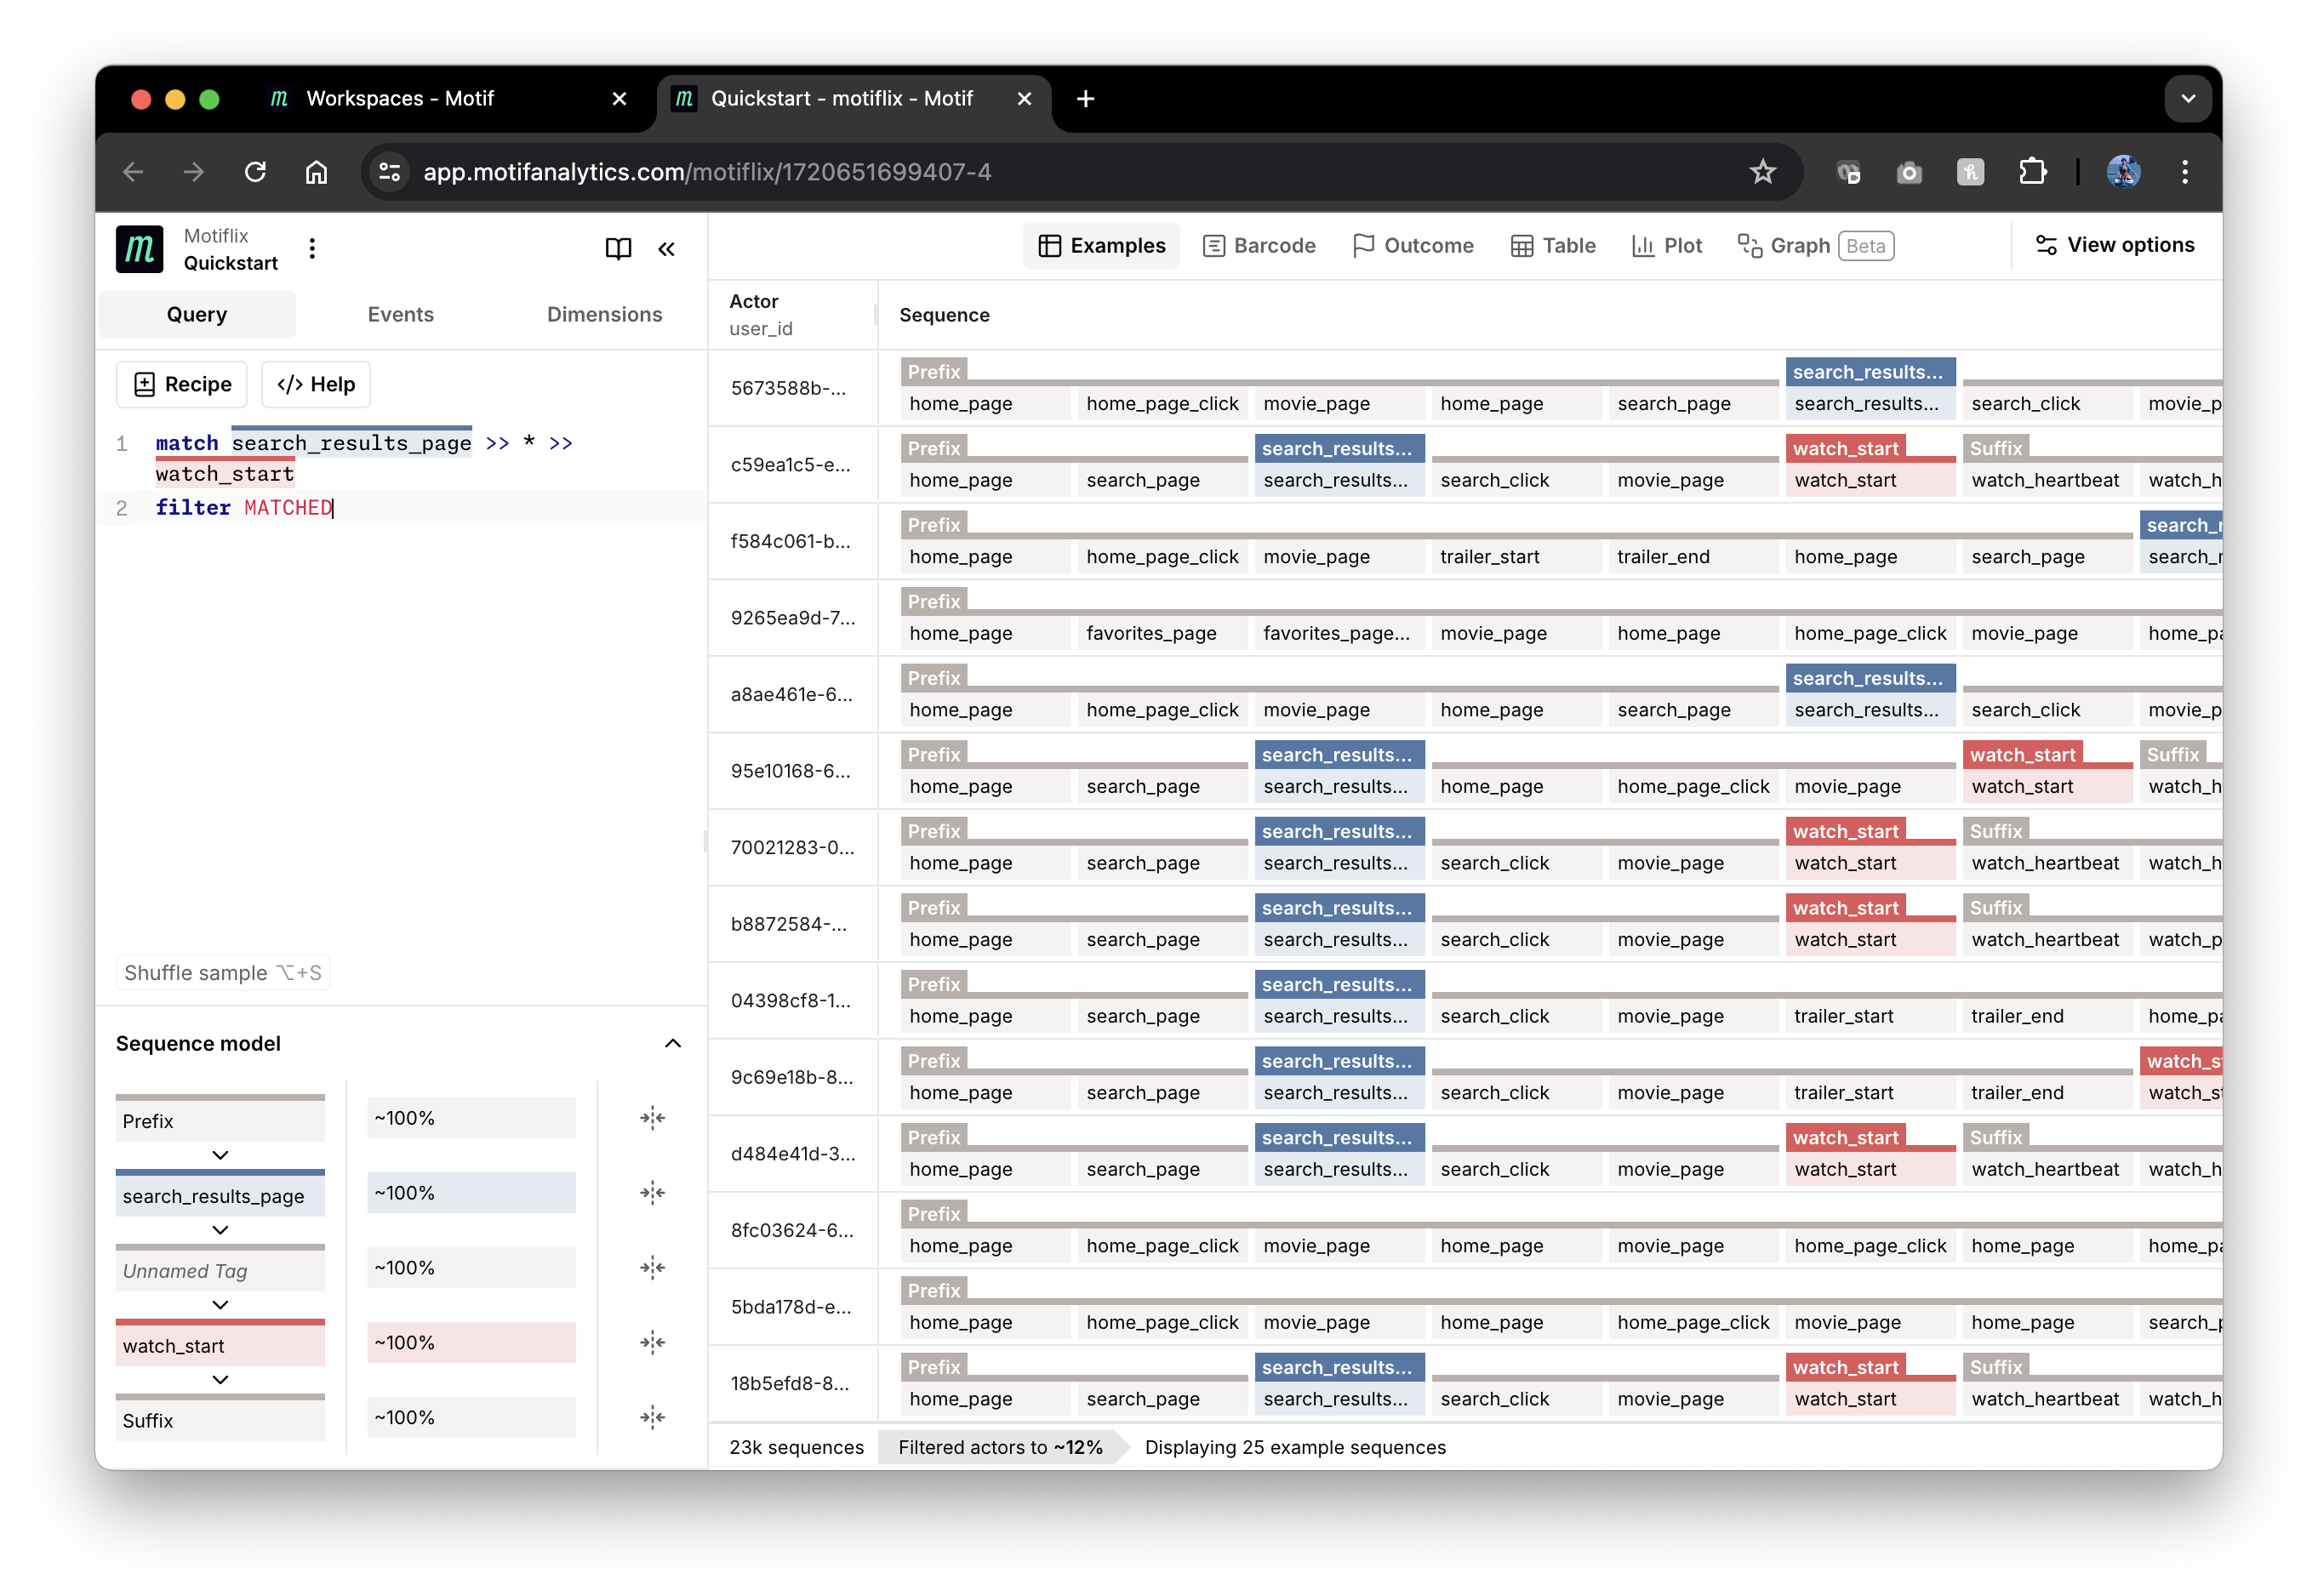
Notice that matched watch_start events are displayed with red tags.
As we can see from the screenshot above, events in between might contain
home_page or other search_result_page events. To find situations where
searching directly led to starting to watch a movie, we can add an exclude list
of event names to the middle state:
match search_results_page >> (^home_page,search_results_page)* >> watch_start
filter MATCHED
The symbol ^ is just like the NOT operator in regex and we need to group
excluded events into ().
We can narrow user behavior further to situations where searching directly led to starting to watch a movie within 2 minutes with no more than 5 events in between:
match search_results_page >> (^home_page,search_results_page){0,5} >> watch_start
  if watch_start.ts - search_results_page.ts < 2min
filter MATCHED
{0,5} is another event quantifier from the regex syntax.
search_results_page.ts and watch_start.ts access a time event dimension
ts on the events tagged by the match. Here are the results:
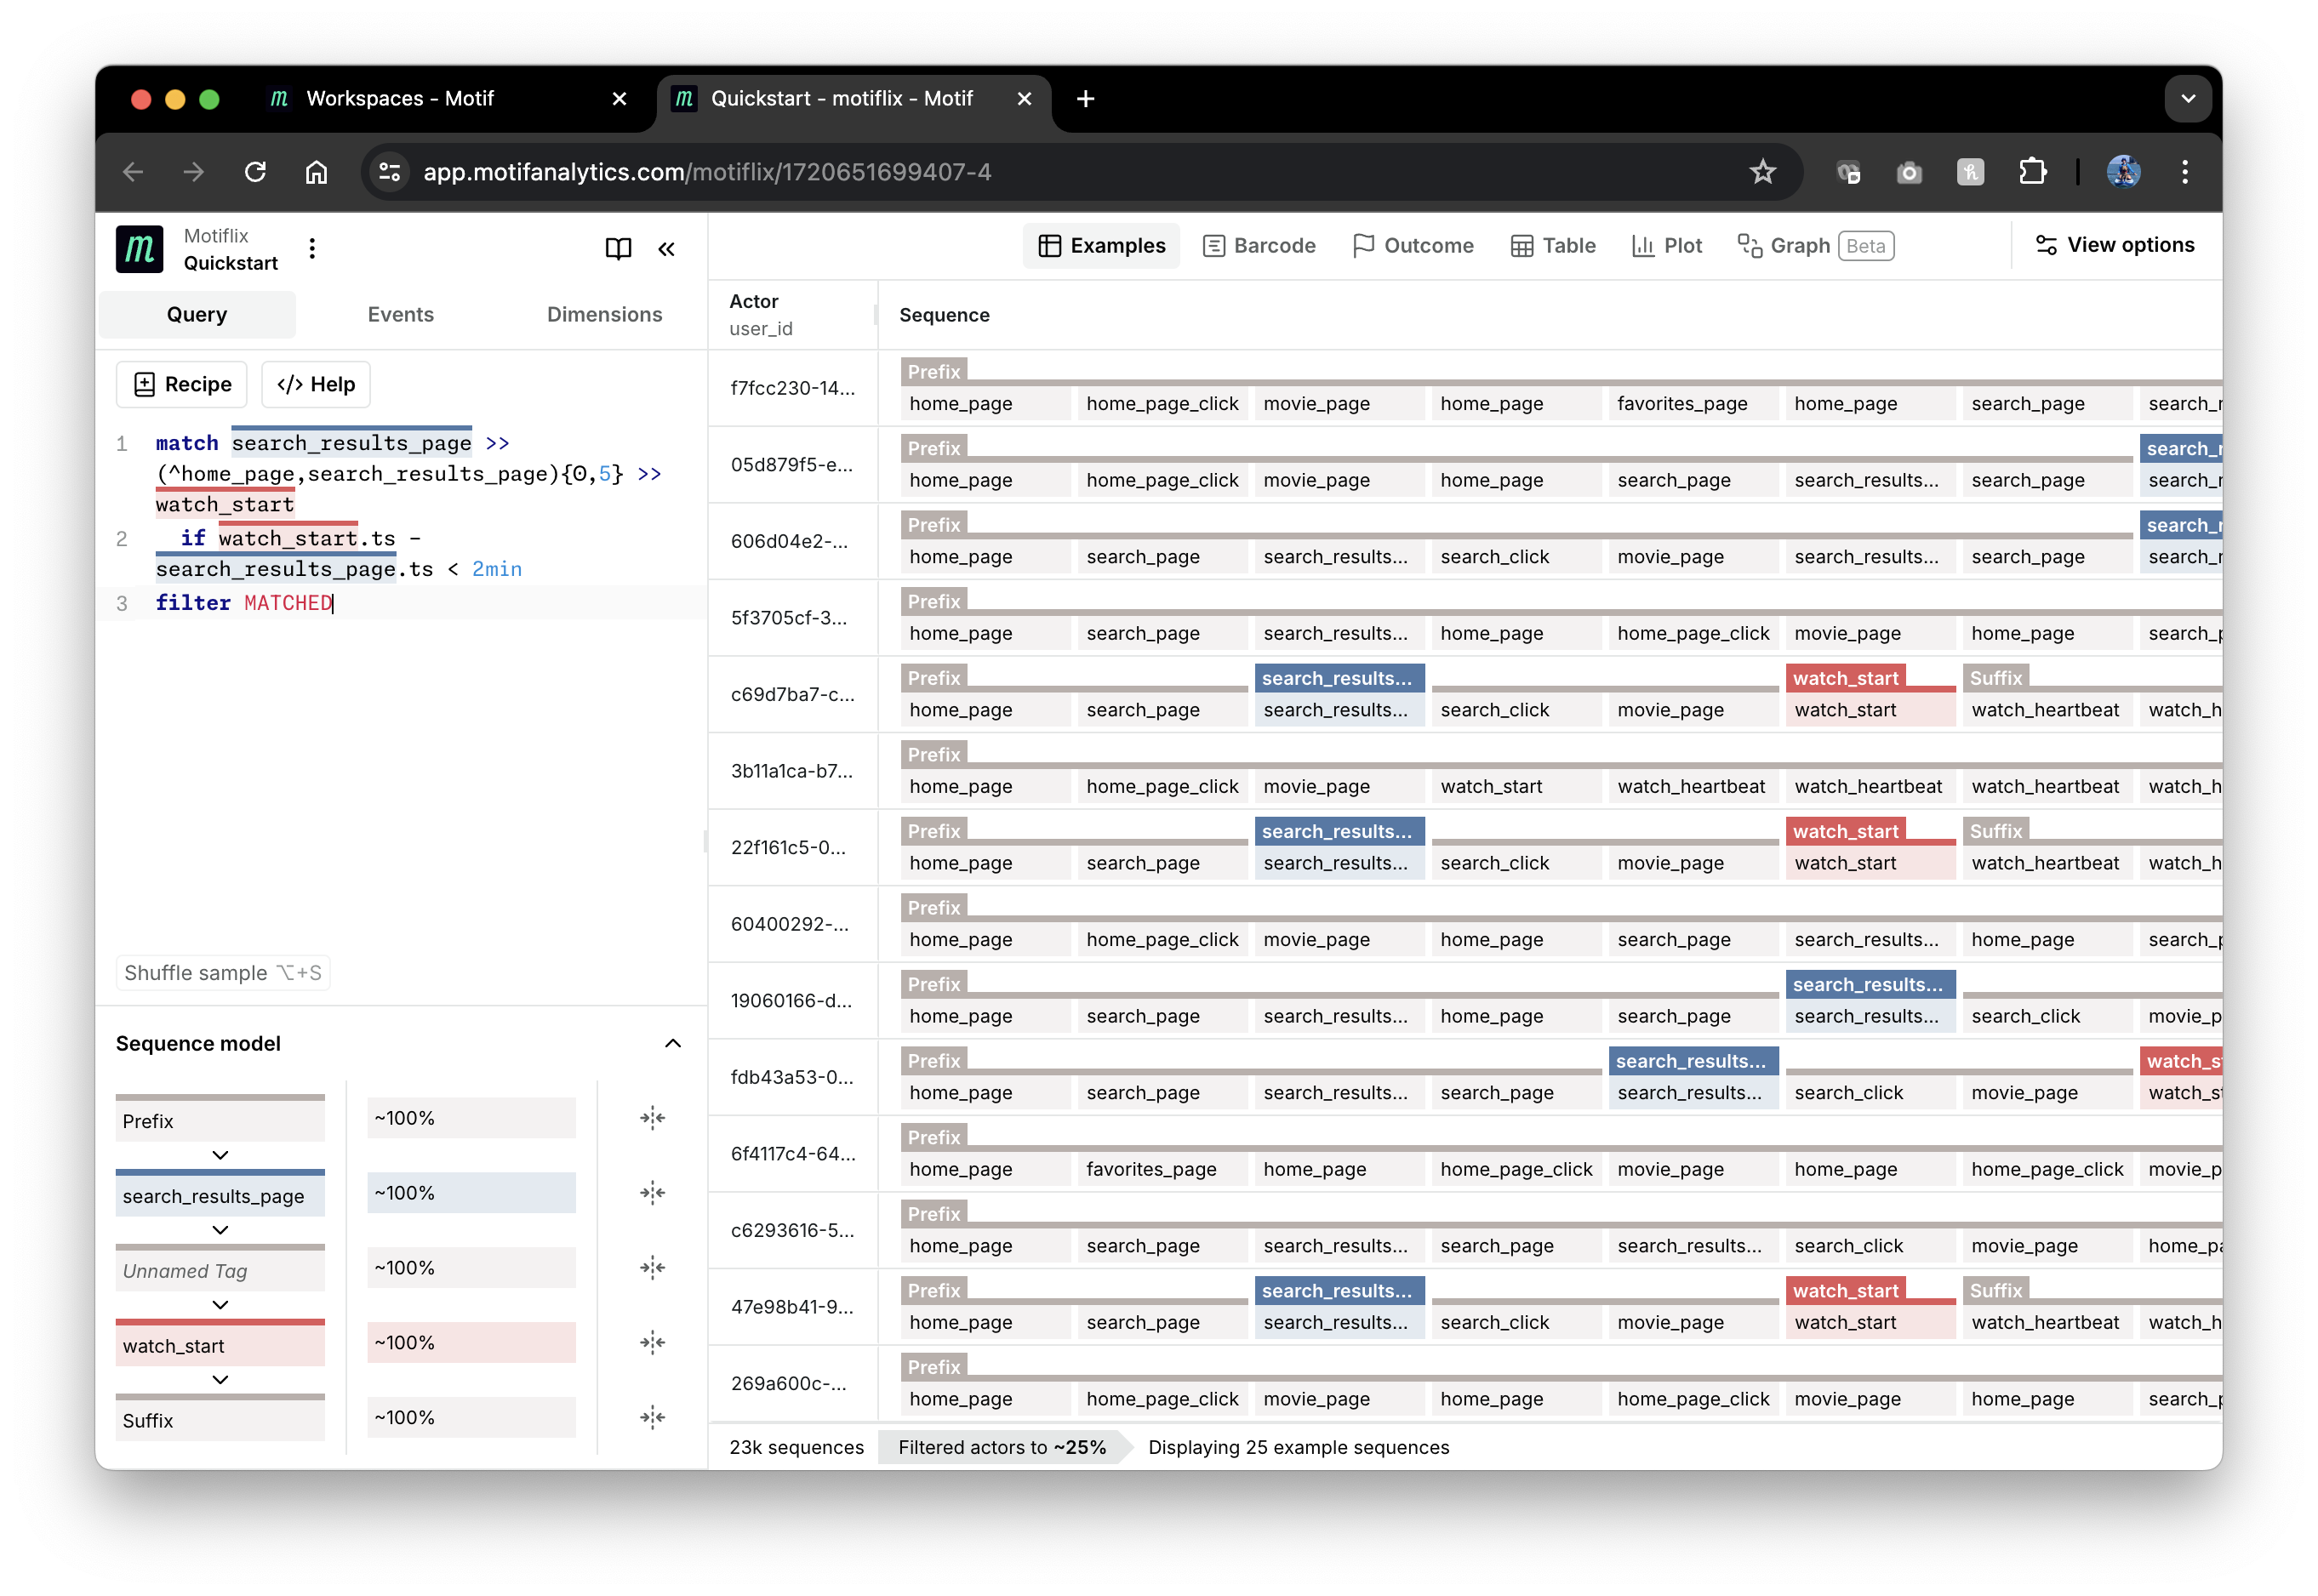
Notice that the number of matched sequences - "Filtered actors to ...%" metric at the bottom of the page - went down from ~23% to ~14%.
Next, let’s see if the number of returned search results is correlated with
whether a user starts watching one of them. By having watch_start event in the
query, we filter out sequences without watches. We need to capture whether users
start movies after searching, and we can do it by adding an optional ?
quantifier to the watch_start state:
match search_results_page >> (^home_page,search_results_page){0,5} >> watch_start?
  if watch_start.ts - search_results_page.ts < 2min
filter MATCHED
Visualizing the results
SOL allows you to operate within a single sequence, but cannot perform aggregations across sequences. Use Motif's visualization suite to compute aggregate quantities.
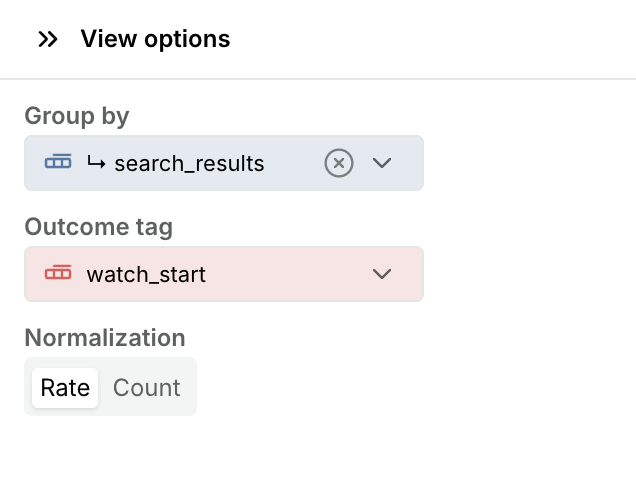
Now we can view the correlation in the "Outcome" view. Navigate to the
Outcome tab, and use the View options in the right panel to group by the
search_results dimension on the tagged search_results_page event and select
the outcome to be the watch_start tag:
As we can see in the top left plot, the probability of watching a movie decreases as more search results are being returned:
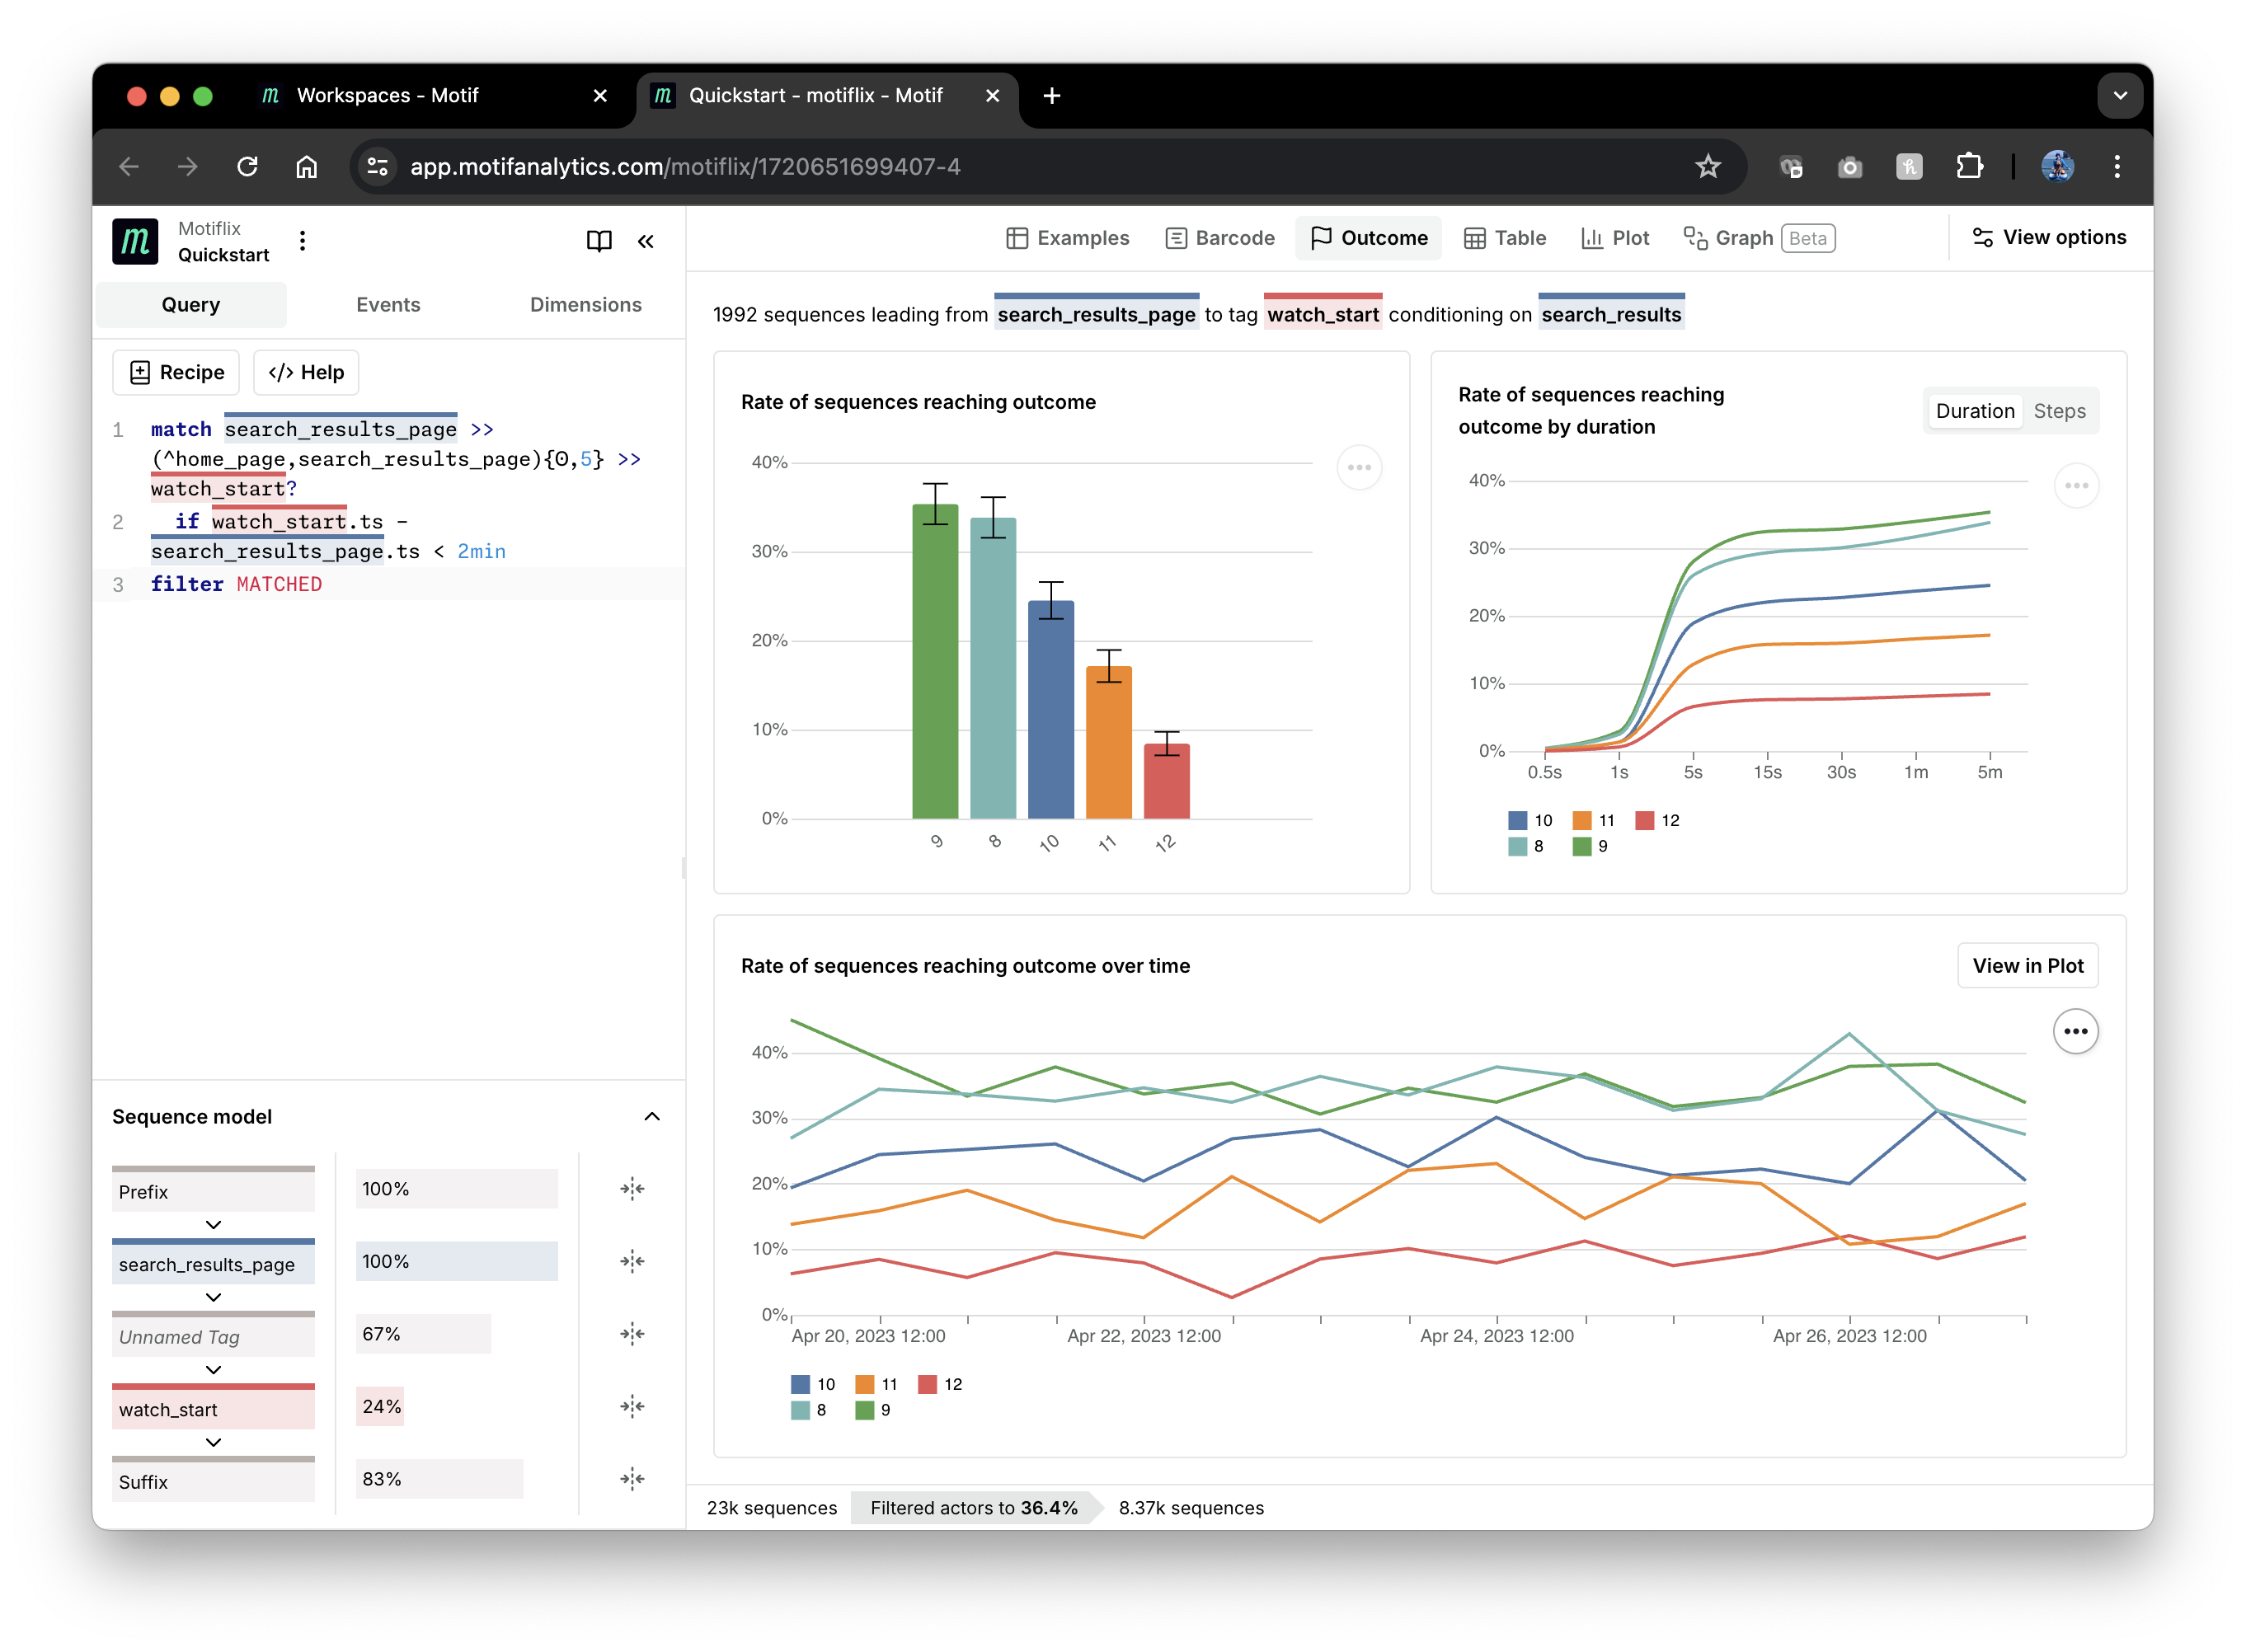
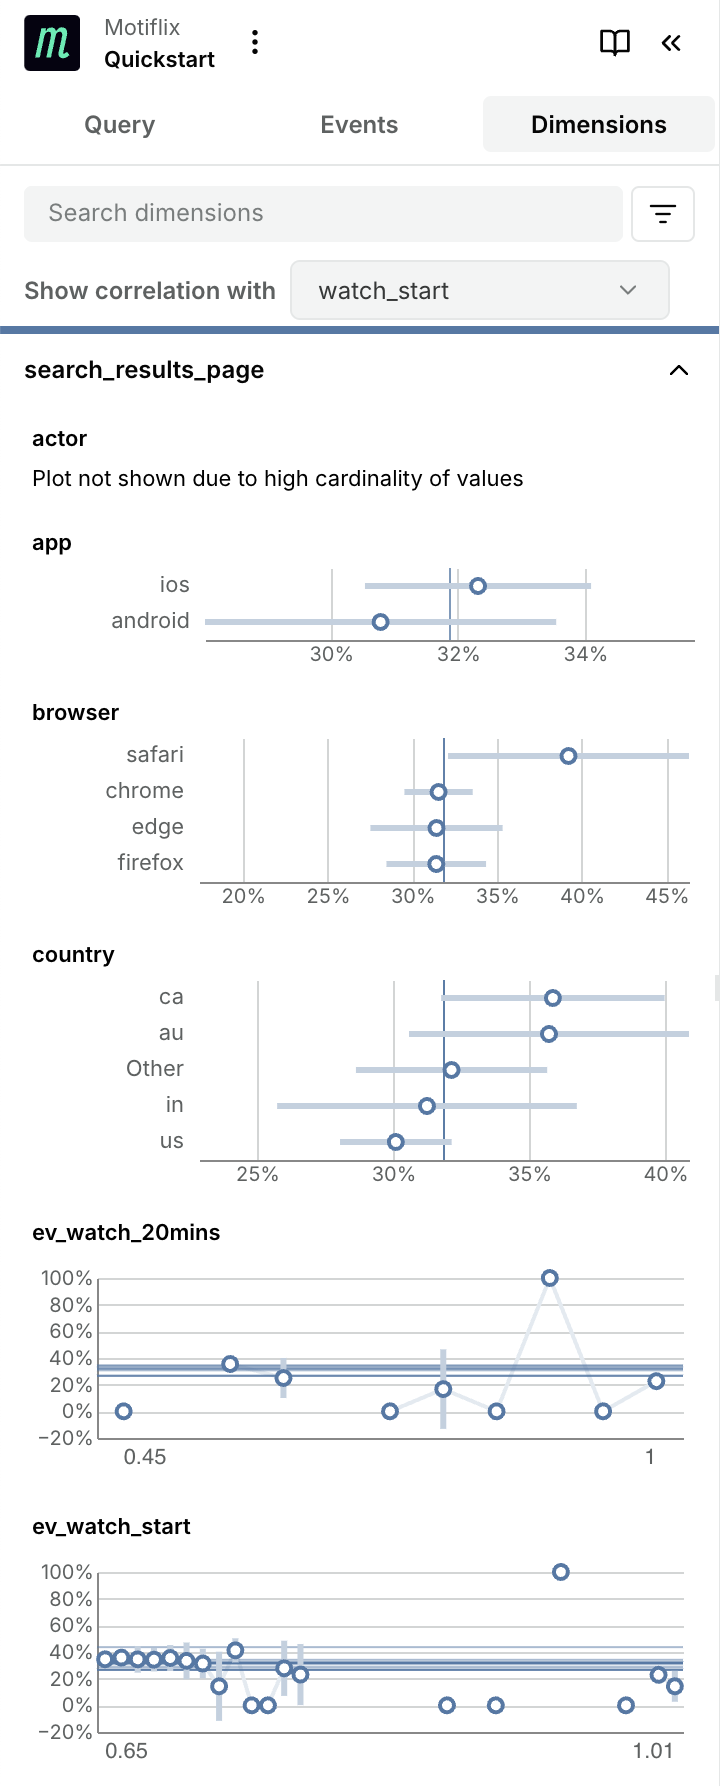
The other plots display duration and number of steps between searching and
watching (top right) and rates of watching over time (bottom). You can also view
correlations of other dimensions of the tagged search_results_page event with
watch_start using the Dimensions tab on the left:
Next, let's explore what user behaviors might be contributing to the observed
differences in watch rates. A good way to do it is by aligning sequences on the
search_results_page event:
match search_results_page
filter MATCHED
... and displaying them in "Barcode" view:
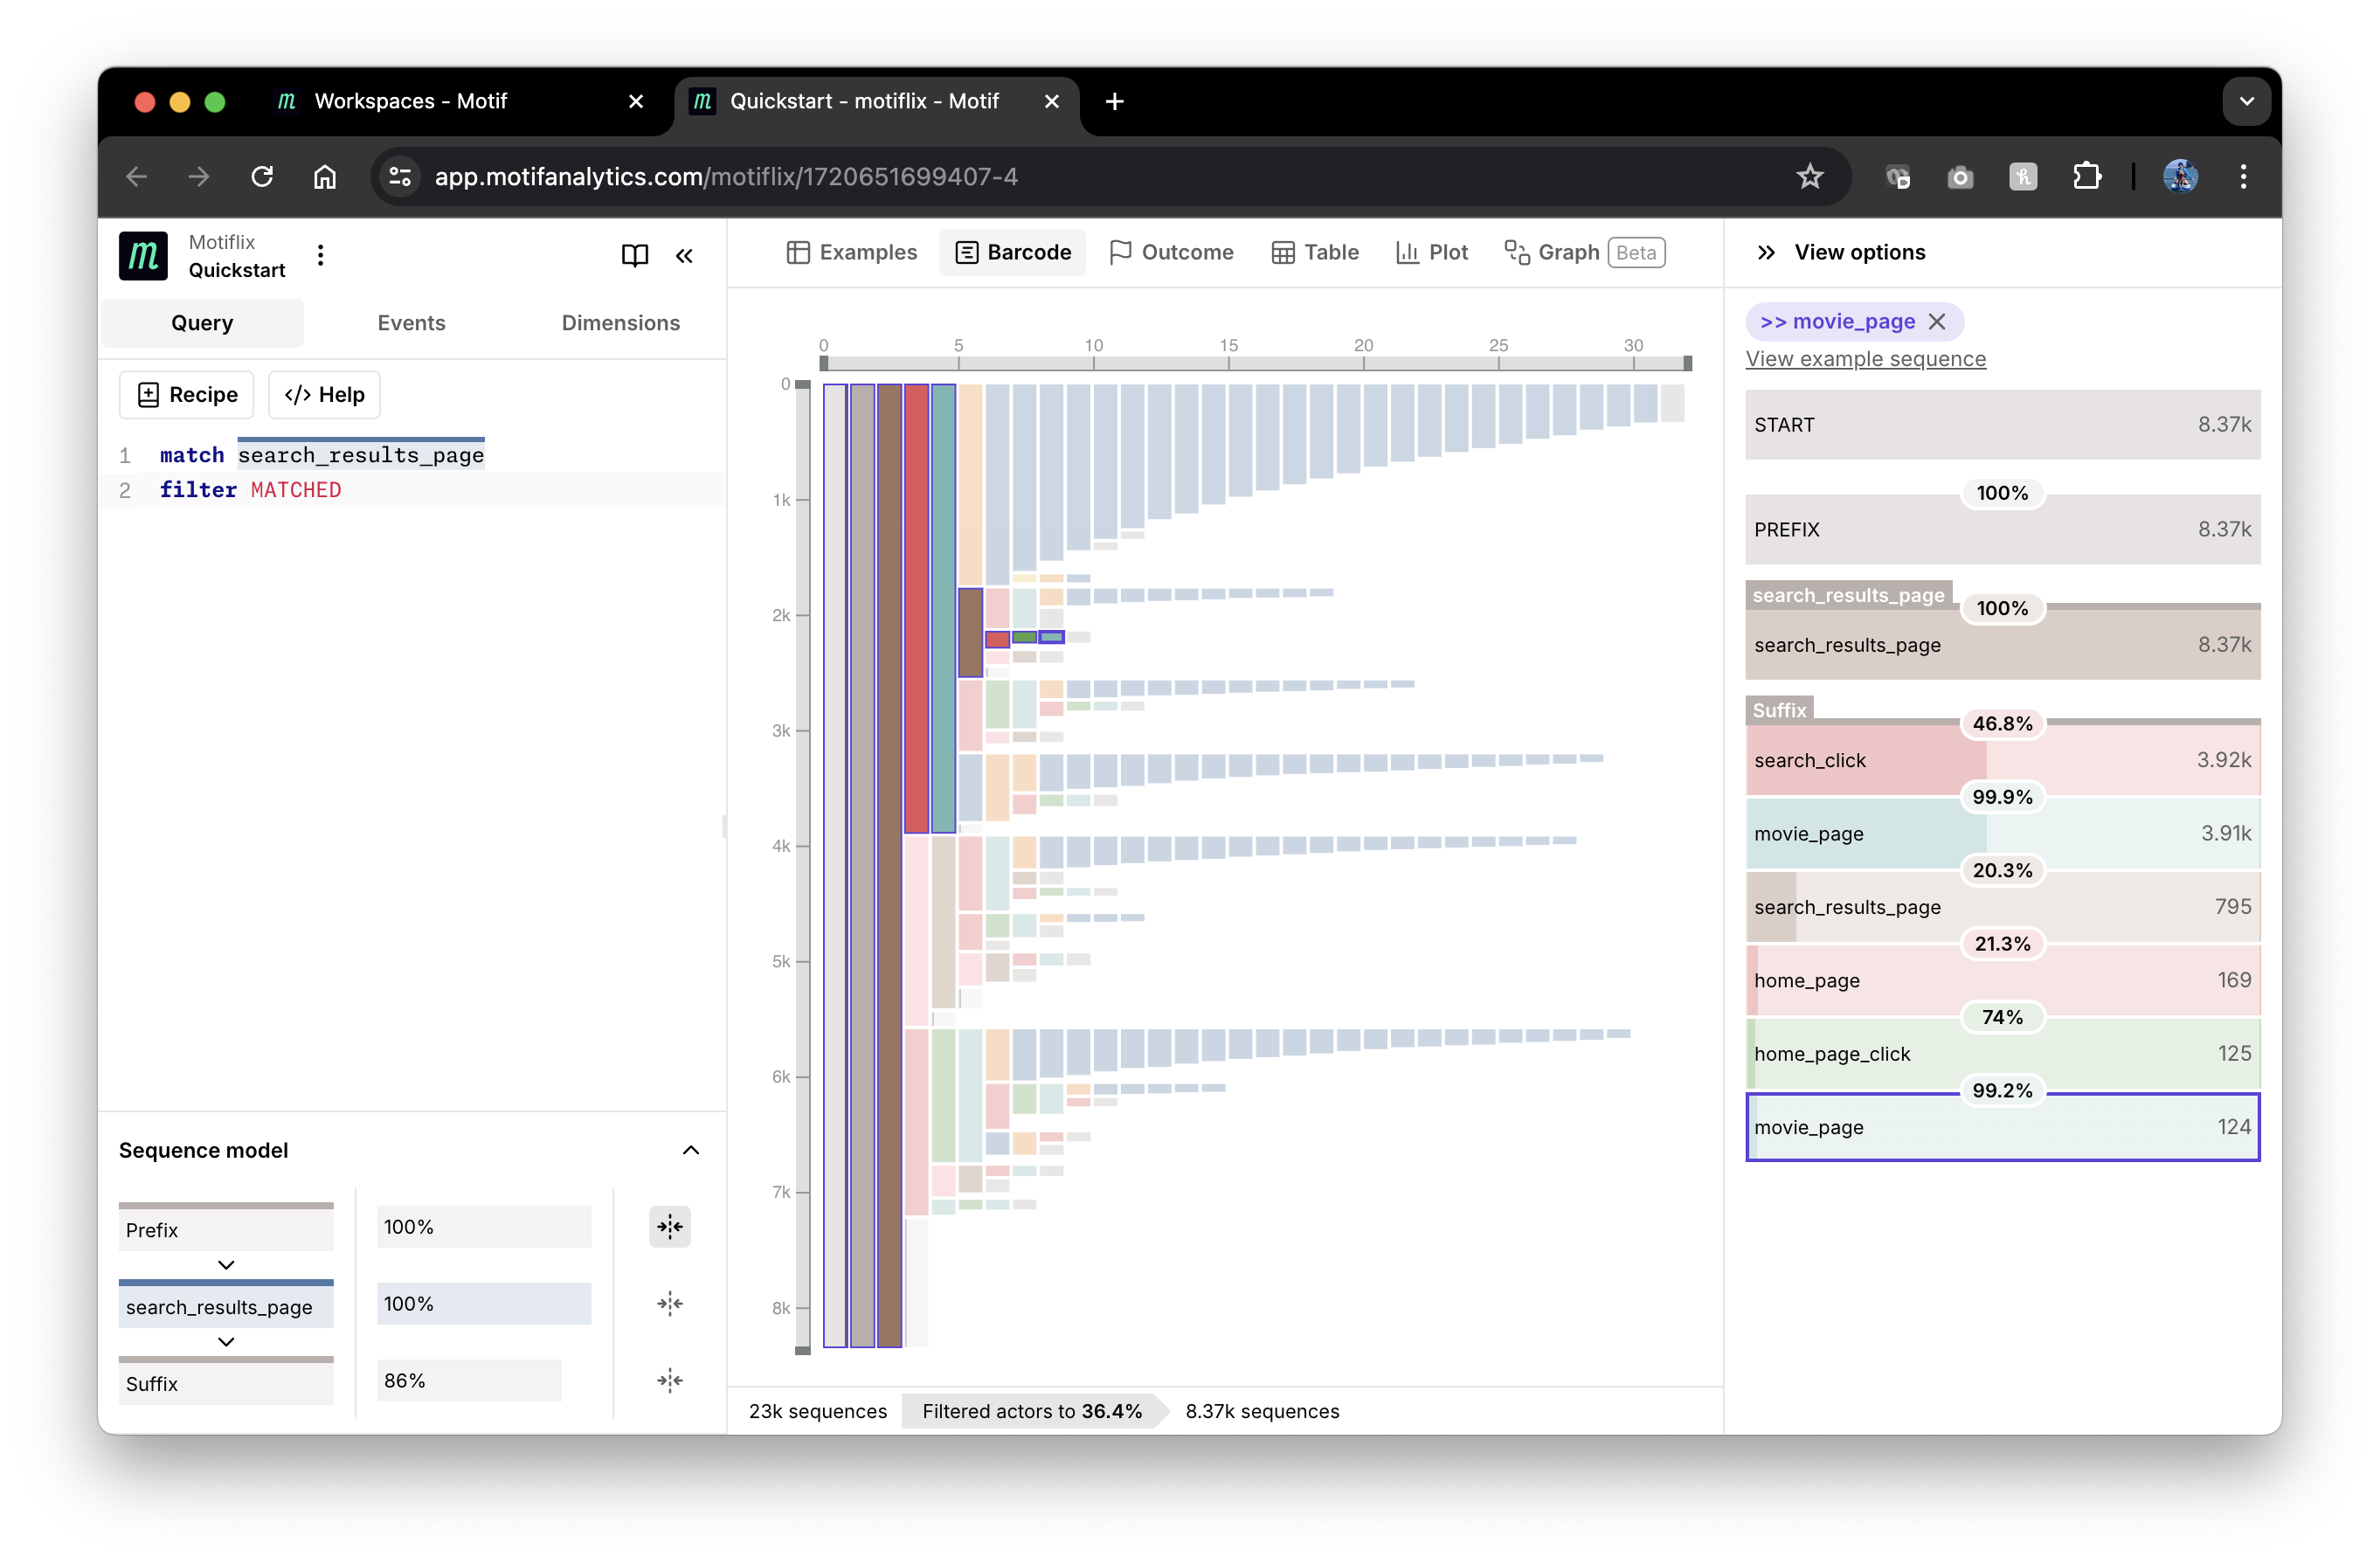
Here you can see the prominence of various user paths starting from the matched event. In the screenshot above, one path is selected and can be viewed as a funnel in the panel on the right.
We can compare user paths with low and high number of returned search results by
coloring by "Compare" in the View options. Set the compare dimension to be
search_results dimension on search_results_page event again, and then set
groups A and B to be 8 and 12 search results, respectively.
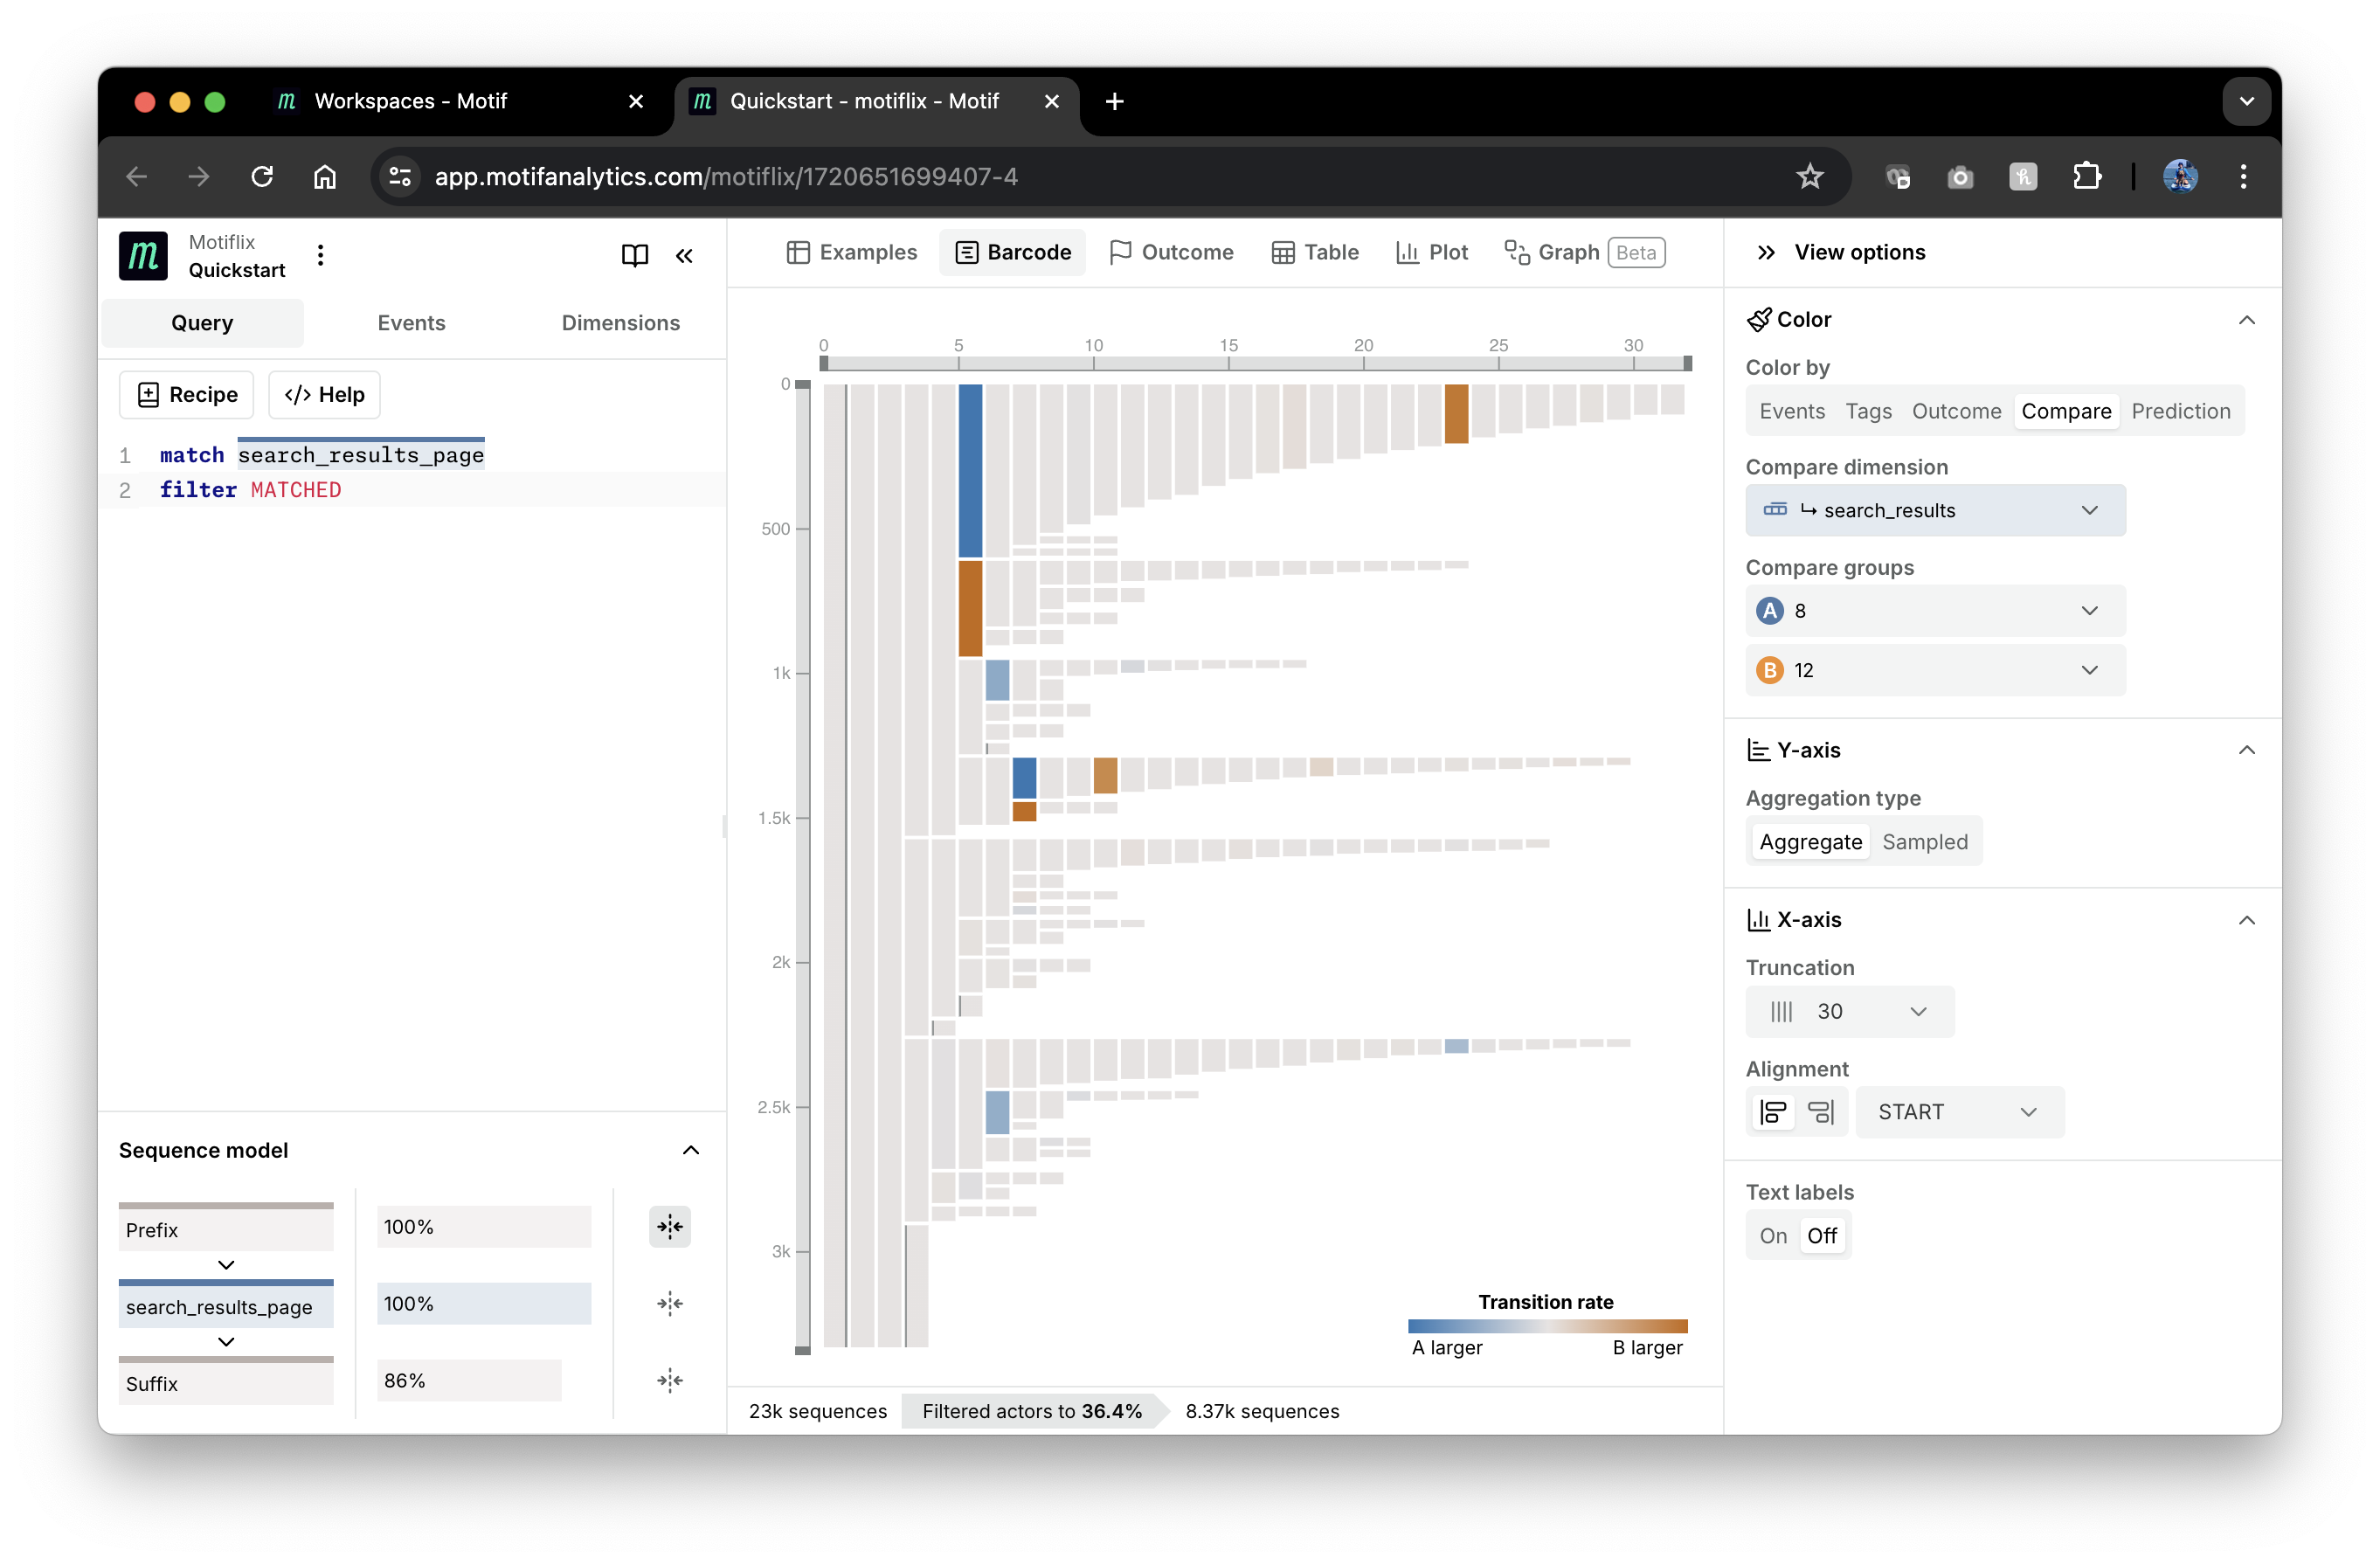
As you can see the plot is mostly grey with some events being blue and some -
red, if there are significant differences in reaching that event. In the
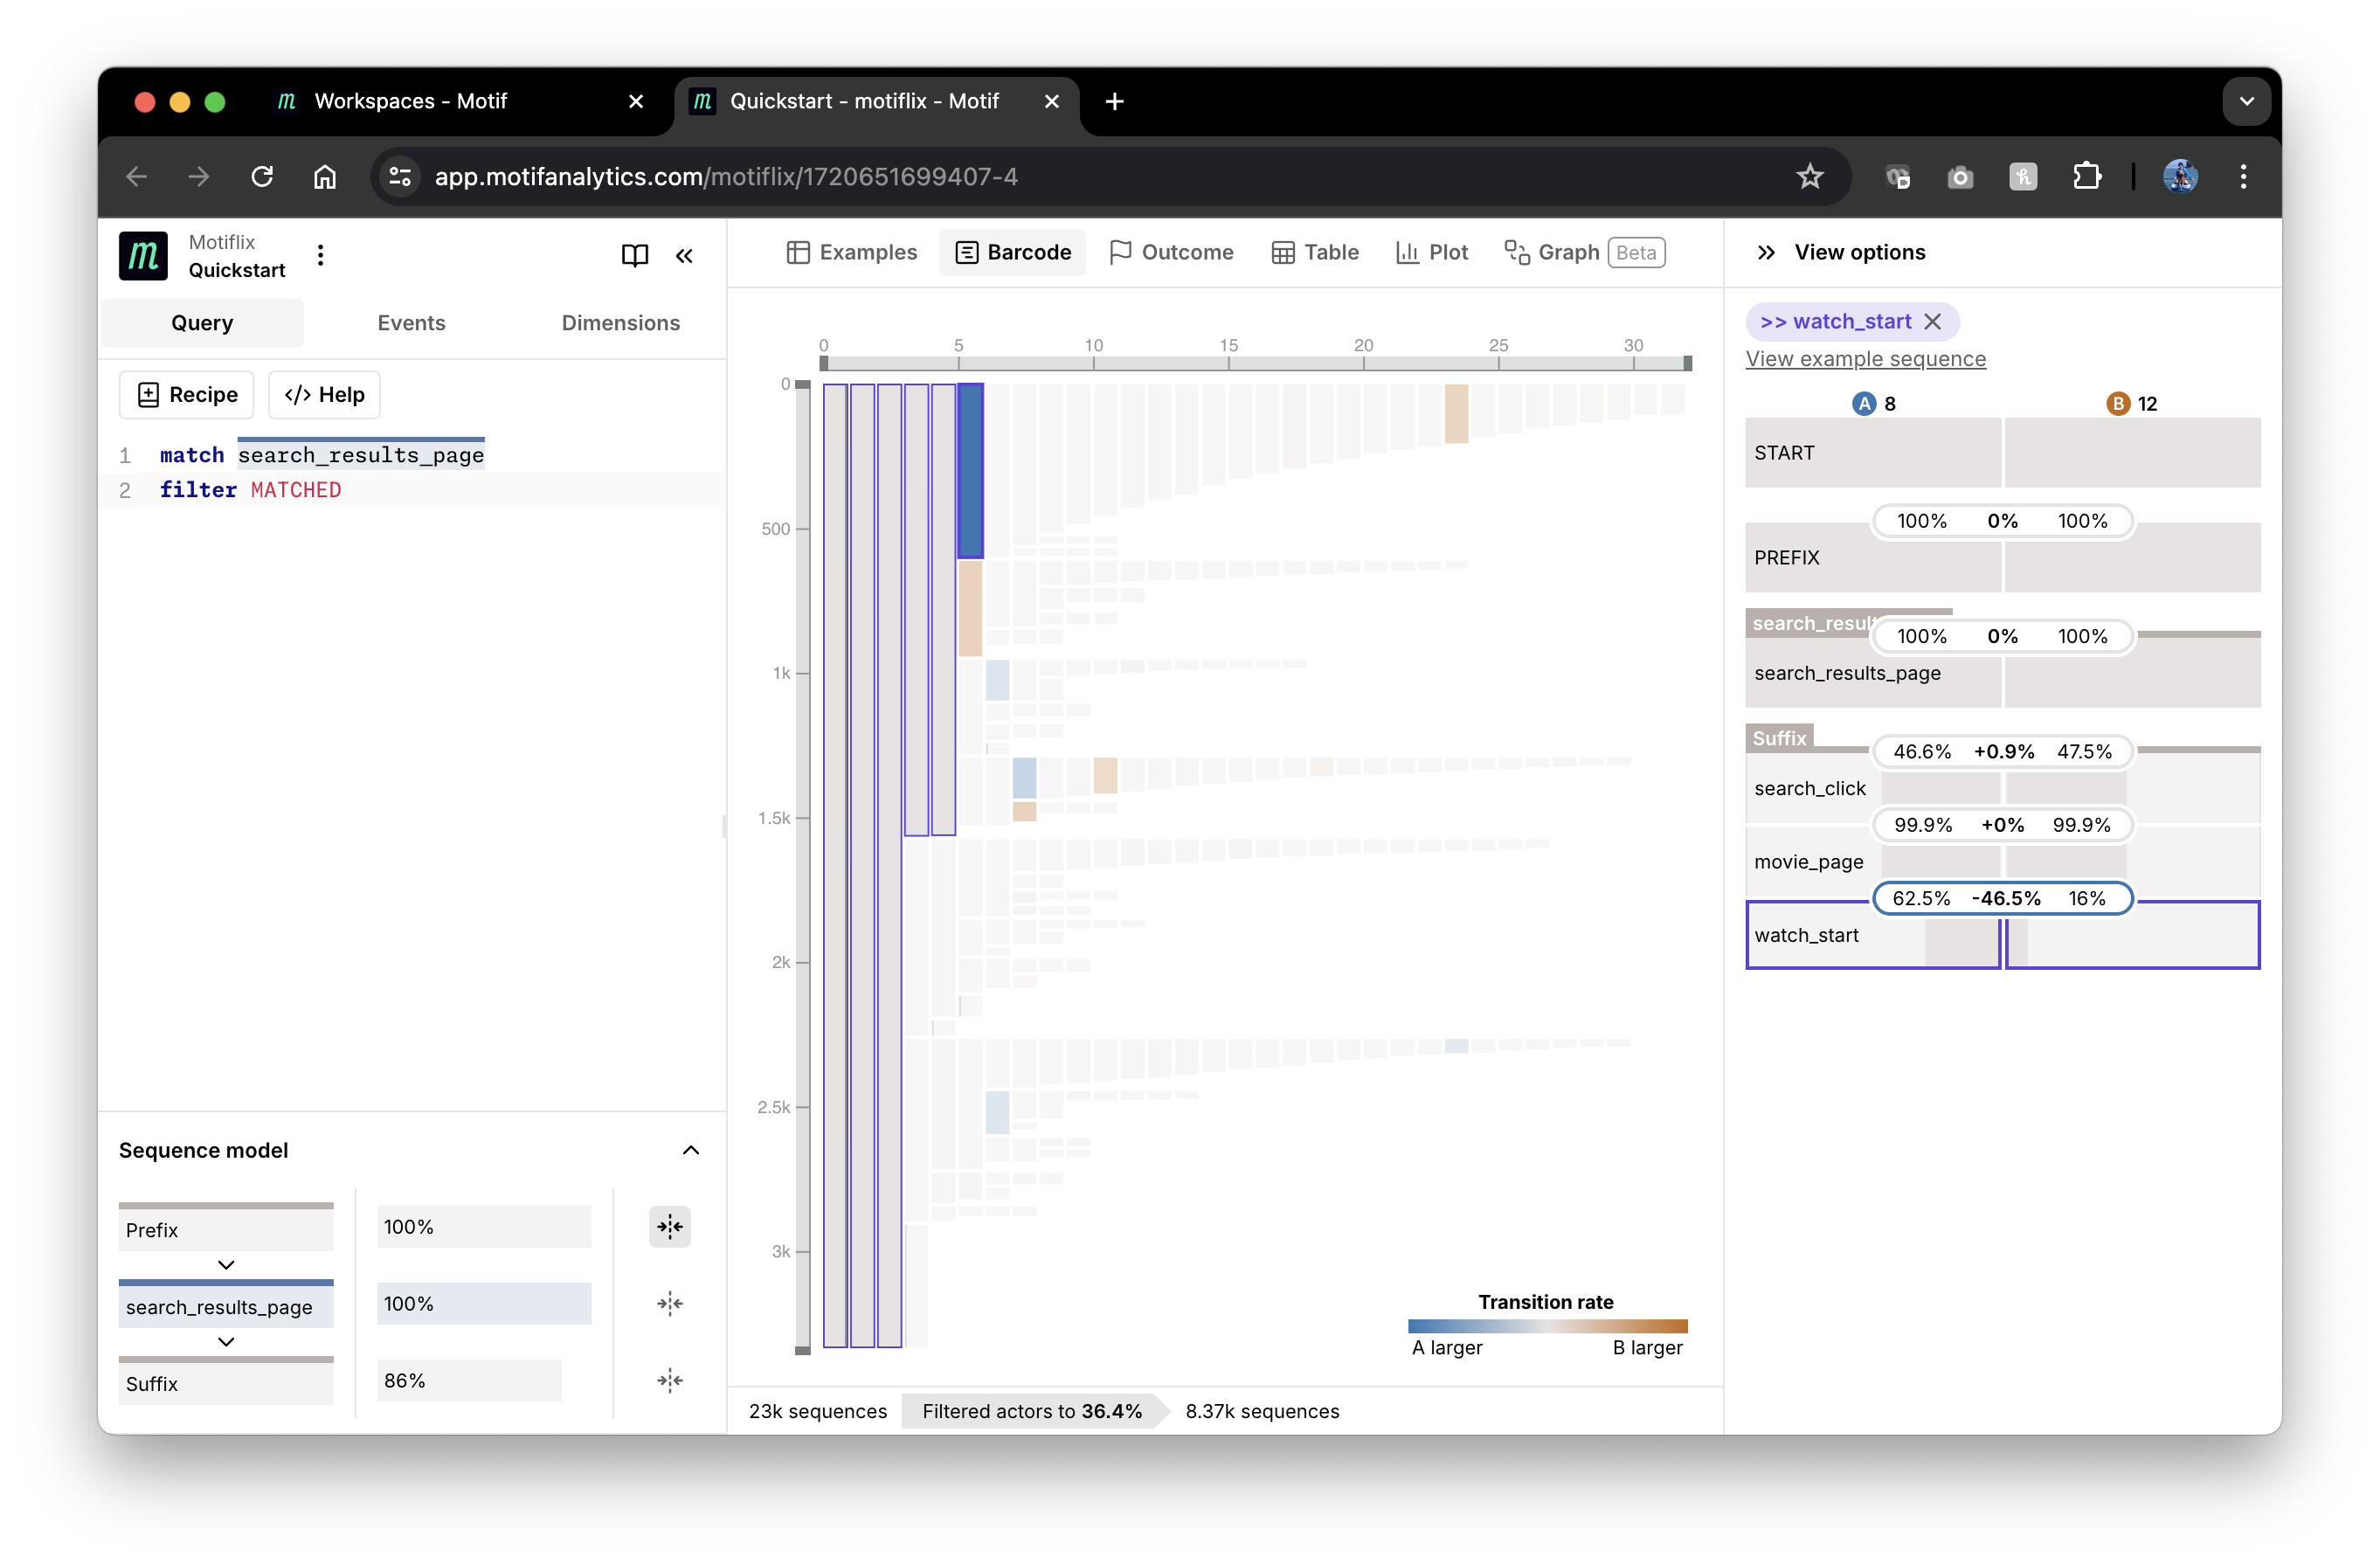
screenshot below, we have selected the big blue node and can see in the right
panel that it corresponds to more users starting to watch a movie from a
movie_page in group A (8 search results) than in group B (12 results): 62.5%
vs. 16%, a difference of -46.5%.
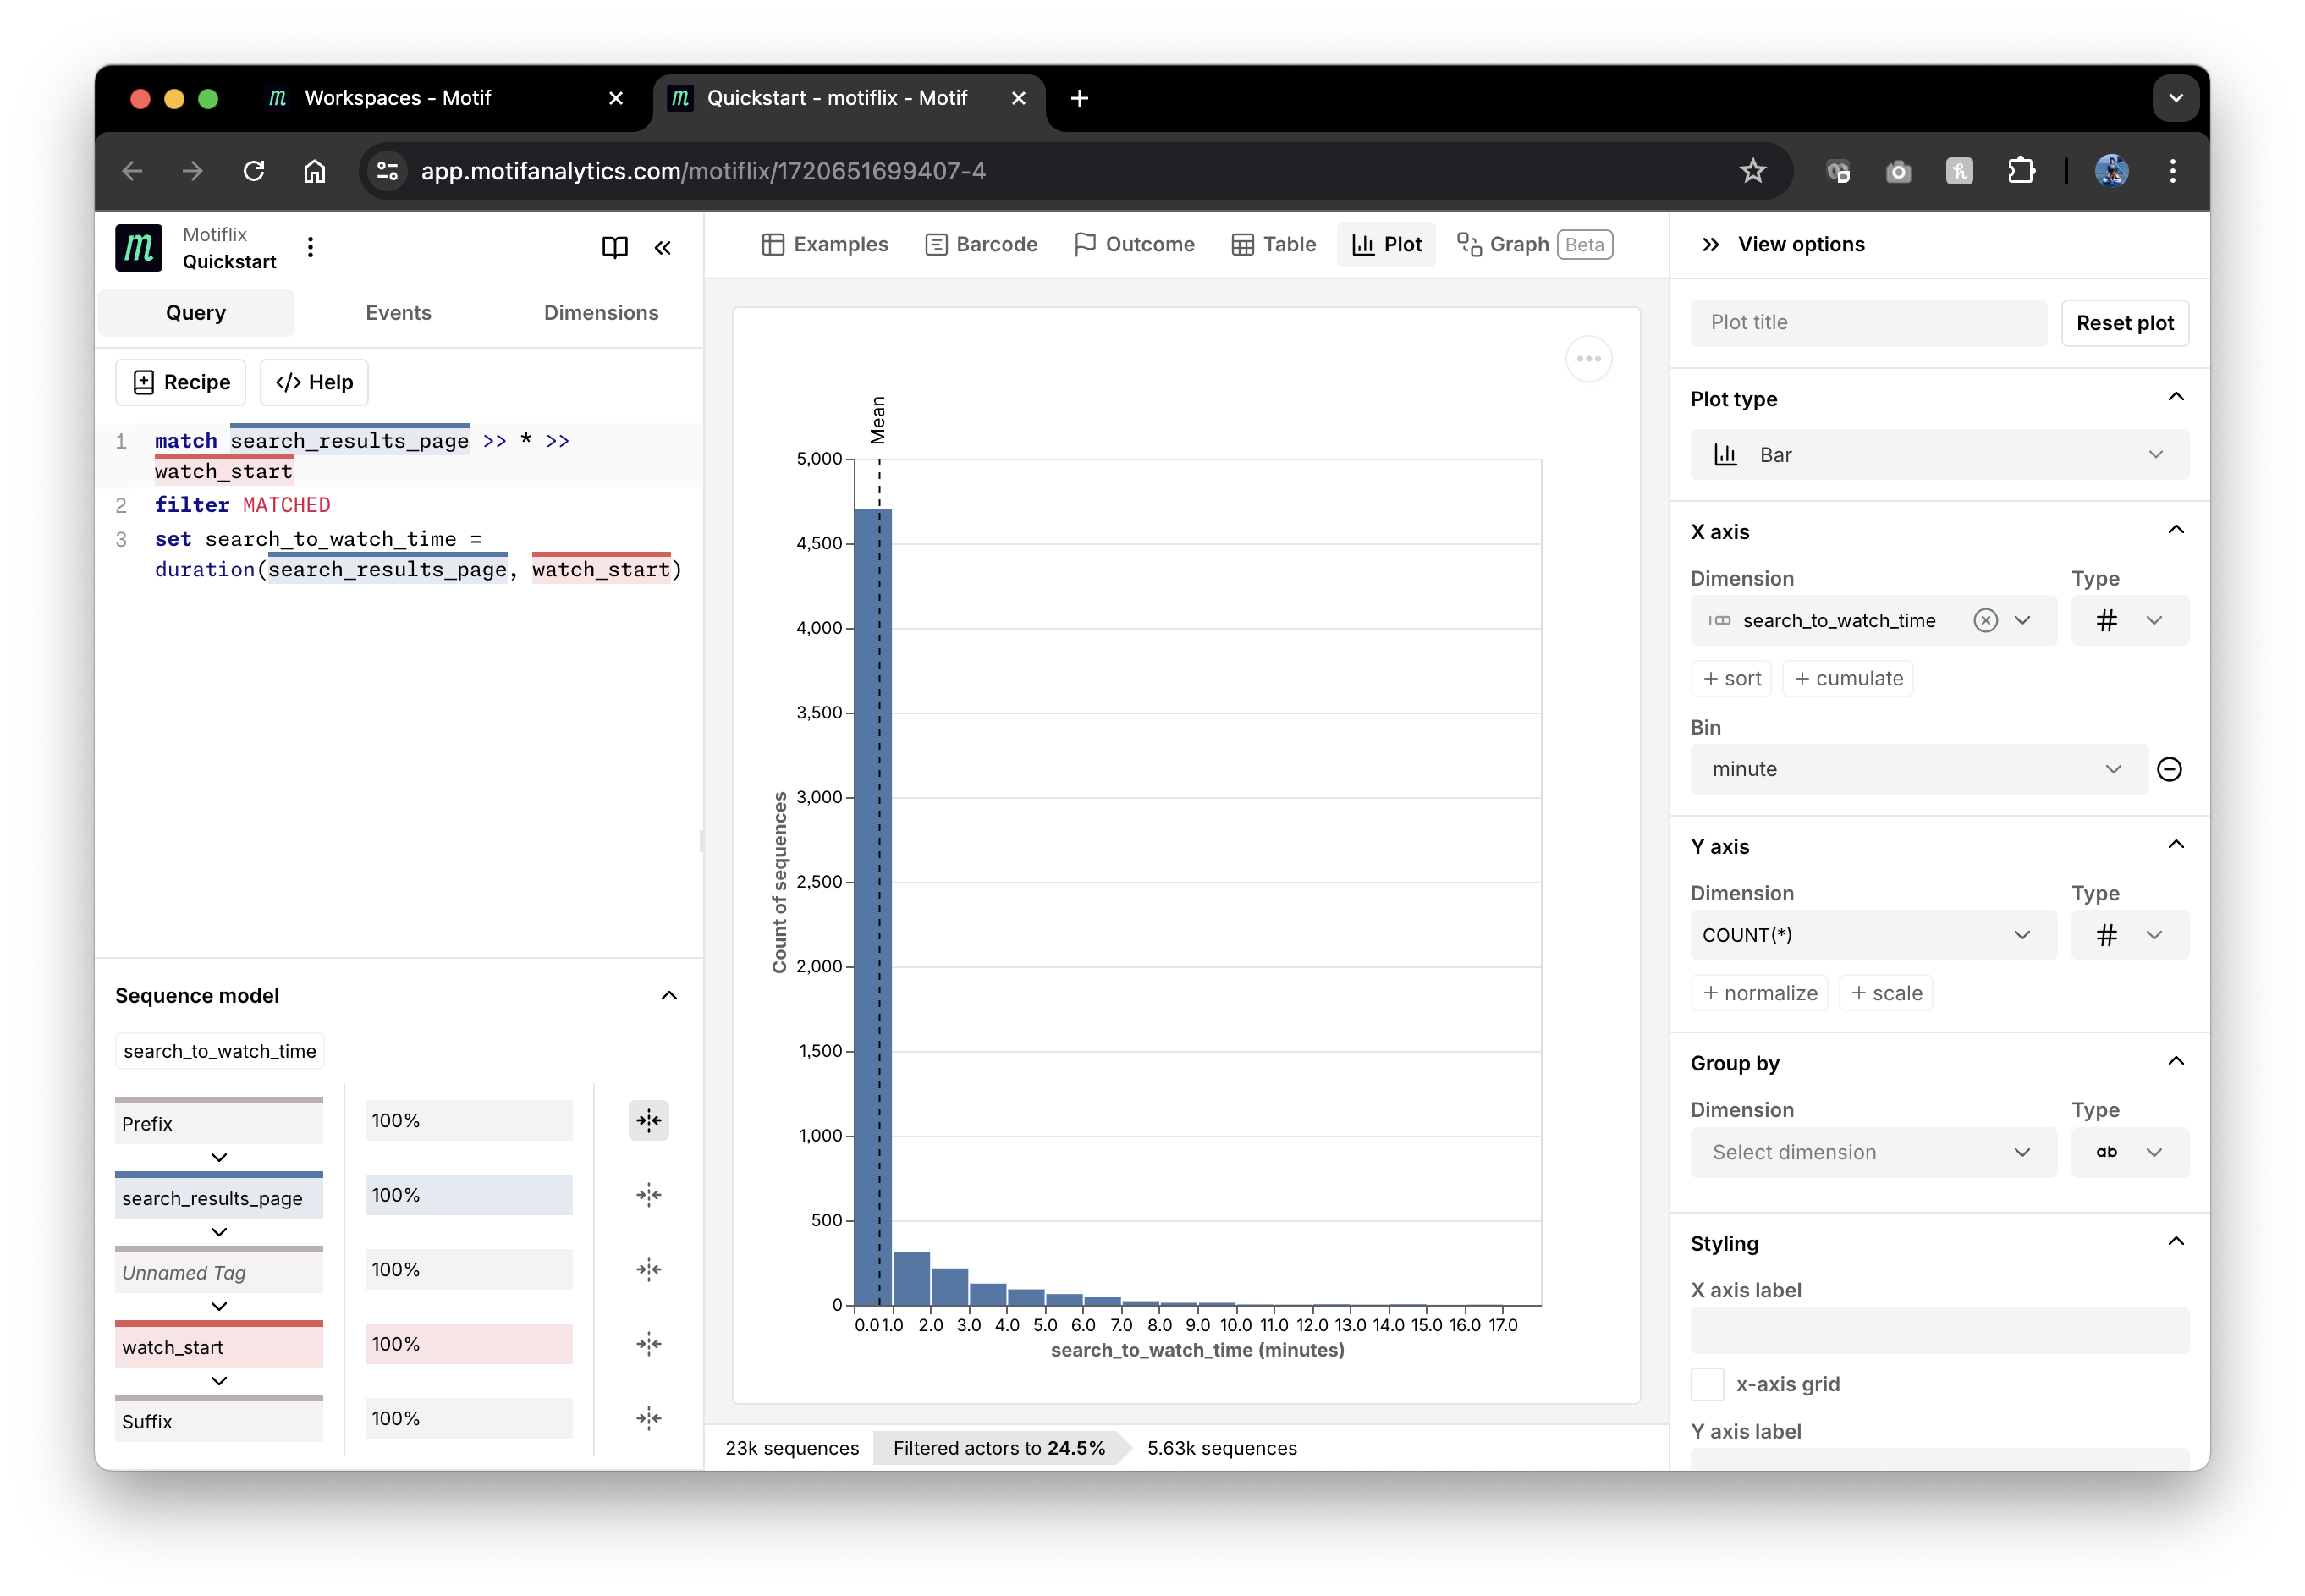
Finally, let’s compute the distribution of durations between
search_result_page and watch_start events:
match search_results_page >> * >> watch_start
filter MATCHED
set search_to_watch_time = duration(search_results_page, watch_start)
This query uses the set SOL operation to create a new sequence dimension
search_to_watch_time with the duration() SOL function. You can review a full
list of supported functions in the
SOL reference. Sequence dimensions can be
plotted in the "Plot" view:
Now you know how to write basic SOL queries and use core Motif data visualizations.
Next steps
- Learn how to load your data locally
- Learn more about SOL
- Explore analysis recipes